Inflation is Dead; Long Live Safe Haven Bitcoin
All evidence points to collapsing global demand and a malfunctioning global financial system. Bitcoin stands out as a symmetric hedge.
Topics this week
Making sense of oil price
SLOOS Data Confirms Everything
What it means for Bitcoin
Can Inflation Run Hot with Oil Crashing?
I have been exploring the inflation debate in macro for decades. First, as a gold bug and then a bitcoiner. I found the most common misconception is that inflation is simply when prices go up. That is a counterproductive definition we must move away from. There are unique dynamics present during an increase in the money supply that are not present in a generic period of rising prices. For example, the dreaded wage-price spiral. To be consistent, and to have predictive power, it is vitally important to limit the definition of inflation to an increase in the money supply.
The idea of inflationary spirals in a monetary inflation, has been misapplied to recent price rises, resulting in people expecting a new era of high inflation. This is despite the fact all evidence points to that not being the current situation. Inflationary spirals are not applicable to supply shocks or other causes of price increases, and since the oil price has fallen over an extended period, we can confidently say we are not dealing with monetary inflation.
After it became apparent that CPI was transitory in July 2022 — month-over-month CPI hit 0% and the Federal Reserve started QT — some people who believe in the inflation narrative, switched from a money printing driven inflation to a cost-push model. They reasoned, if oil prices continue to climb, all prices through the economy will be forced higher. Inflation is their foundational belief and their analysis is predetermined to get there.
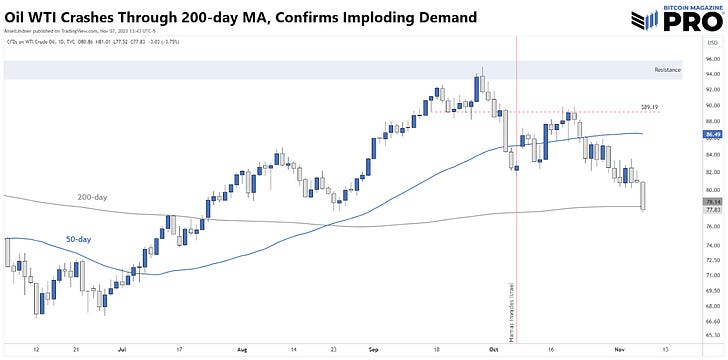
The fact that oil prices moved from $129/bbl in March 2022 to $77 today, 20 months later, despite 4.6 million barrels per day (mbd) in production cuts by OPEC+, is strong evidence that CPI was transitory and no price spiral will happen. Higher prices from lockdowns, war and sanctions simply led to demand destruction.
Oil prices serve as a proxy for overall demand in the economy. I wrote about this coming shift in this letter back on September 27, where I pointed to extreme lows in inventory at Cushing, OK and how they correspond with multi-year tops in oil price, stating that falling demand and price were going to be the dominant dynamic. It was published on the exact day of the high close.
US gasoline demand for September, was the lowest demand in 25 years!
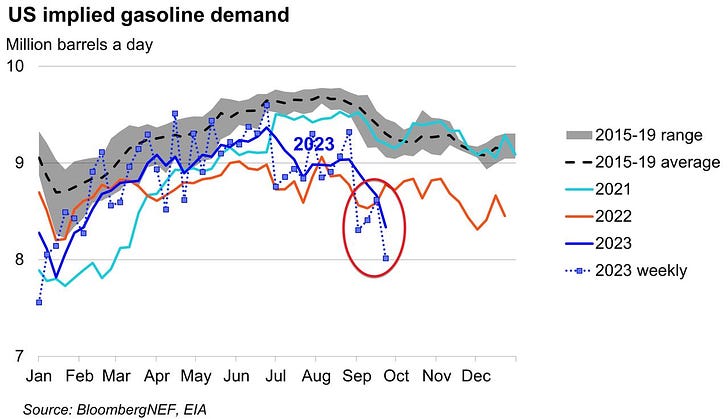
Source: Zerohedge
With oil demand falling, prices across the board should follow. US October CPI comes out next week, and the Cleveland Fed’s Inflation Nowcast estimates a 0.07% MoM (0.84% annualized). That will be replacing October 2022’s 0.48%, pushing YoY down to 3.25%. US Producer Prices (PPI) are upstream from Consumer Prices (CPI) and recently hit 0% YoY.
European PPI looks even worse. It has crashed to -12% YoY. What would you say that means for oil demand?
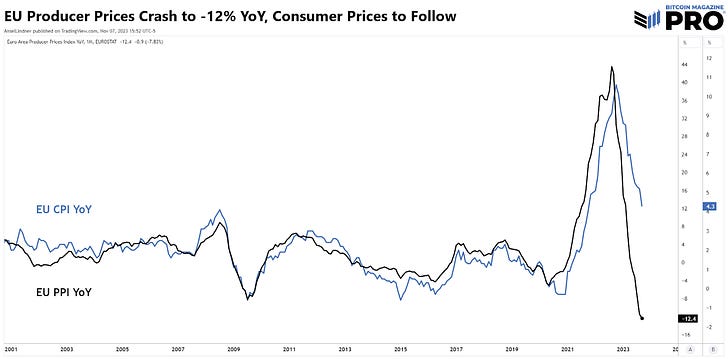
All this adds up to demand destruction, not an inflationary spiral. Recession is coming, a flight to safety is already underway. And as I’ve written in this letter in recent weeks, bitcoin is capturing the investment public’s imagination as a symmetric safe haven.
SLOOS Data Show Massive Recession Pressure
If that wasn’t enough, we got the latest Senior Loan Officer Opinion Survey (SLOOS) from the Fed. Money is printed when a commercial bank makes a loan. Therefore, we can look at Total Commercial Bank Credit as a close proxy for supply of base money in a debt-based system.
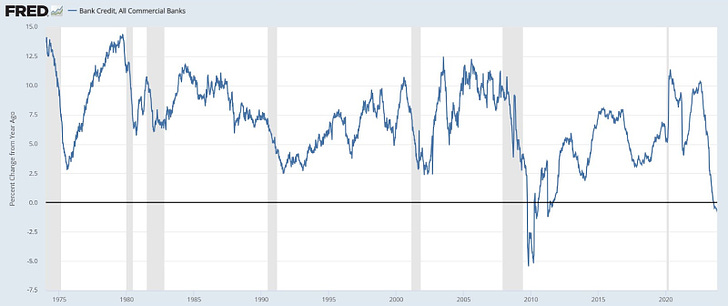
Declining bank credit matches our oil analysis of falling demand. This can also be confirmed using the SLOOS data.
Each quarter, the Fed surveys the banks asking about their lending standards and demand for loans in several categories. Commercial & Industrial loans (C&I), Commercial Real Estate (CRE), Residential Real Estate (RRE), Home Equity Lines of Credit (HELOC), and other loans like credit cards and auto loans. In all categories, banks reported tightening lending standards and falling demand again this quarter.
Below are two examples of the charts included with the report.
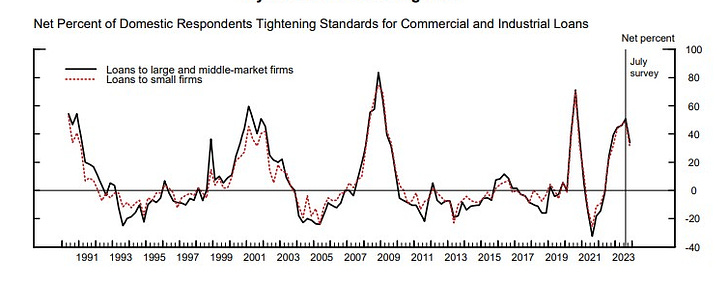
Source: Federal Reserve
These charts show a minor improvement on the rate of tightening lending standards and falling demand for loans, but again, this data confirms what the bank credit chart and the oil price is telling us. Recession and its associated deflation is upon us.
Bitcoin Spring is Compressing
If demand destruction and deflationary pressure are everywhere, how can bitcoin rise over 100% in 2023? If you are asking that question, you are looking at the system all wrong. The inflation narrative for bitcoin is taking a backseat to its role as a safe haven asset in a deflationary monetary revolution.
This current bout of economic troubles is part of a much larger history going back to WWII and Bretton Woods. It is a story of an evolving money and global financial system. As the global economy boomed, the money supply grew and morphed into exotic forms to allow settlement and movement of credit through international financial plumbing. As long as credit was productive and the debt burden low, the global economy sustained rapid expansion of the money supply. However, the tipping point was reached in the Great Financial Crisis. In that crisis, diminishing marginal returns on debt flipped the math. The fate of the system was sealed as an eventual deflationary bust. Sure, there can be periods of reflation, but malinvestment has to deflate.
It is, perhaps, divine timing that just at that moment is when Bitcoin arrived as a lifeboat. The main role of bitcoin in this era is going to be as a safe haven against deflationary pressures. Just as Paul Tudor Jones, Mohammed El-Erian, Stan Druckenmiller, and Larry Fink are now saying.
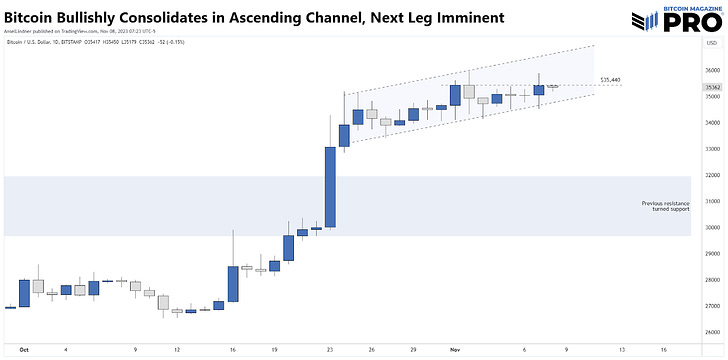
Let’s get to some charts.
The daily chart shows a bullish consolidation in an ascending channel. I’ve highlighted the highest daily close $35,440, which once broken by a new close, will send price to the top of the channel at ~$36,600.
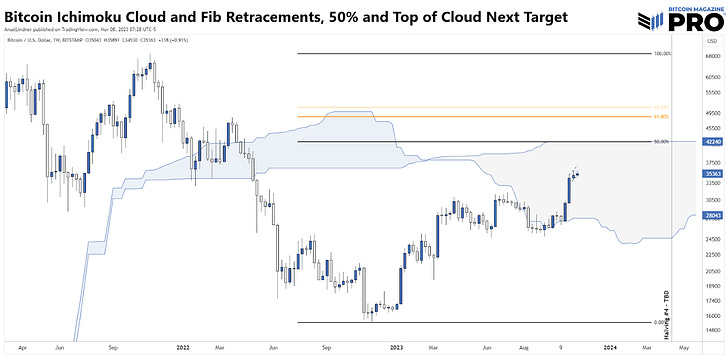
Below is a stripped down weekly Ichimoku cloud (h/t @CarpeNoctum) showing our progress in an edge-to-edge trade. The top of the cloud at $42,000 and aligns with the 50% retracement level. That is an extremely likely target for the next leg of this rally. I’ve also highlighted the Golden Pocket, between the 61.8% and 66% retracements. Bitcoin has never failed to hit the Golden Pocket prior to the halving.
Staying on the weekly chart, price is sitting right at the last line of resistance, from the close back on January 23 2022. The volume profile also shows a last hump, before exposing a low resistance area.
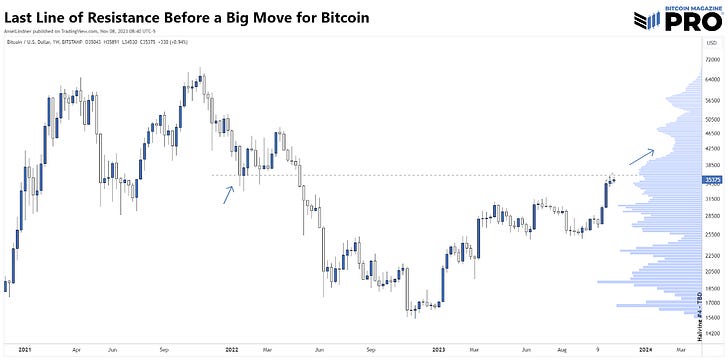
These charts are explosive. We are on the doorstep of a great awakening to the reality of bitcoin as a safe haven. Everything is pointing to collapsing demand and a malfunctioning legacy system.


