Does Bitcoin Have Less Than 100 Days Left In This Cycle?
Past Bitcoin cycles suggest a Q4 2025 peak as ETF and treasury accumulations tighten supply while MVRV Z-Score hints at a potential parabolic run to $250,000
With Bitcoin’s price hovering around $120,000, speculation about where we are in the current cycle is intensifying. The data, particularly when mapped against previous cycles, suggests that this bull market could top out within the next three months. But does this hold true, or are there reasons to believe this time truly is different?
The 100-Day Countdown
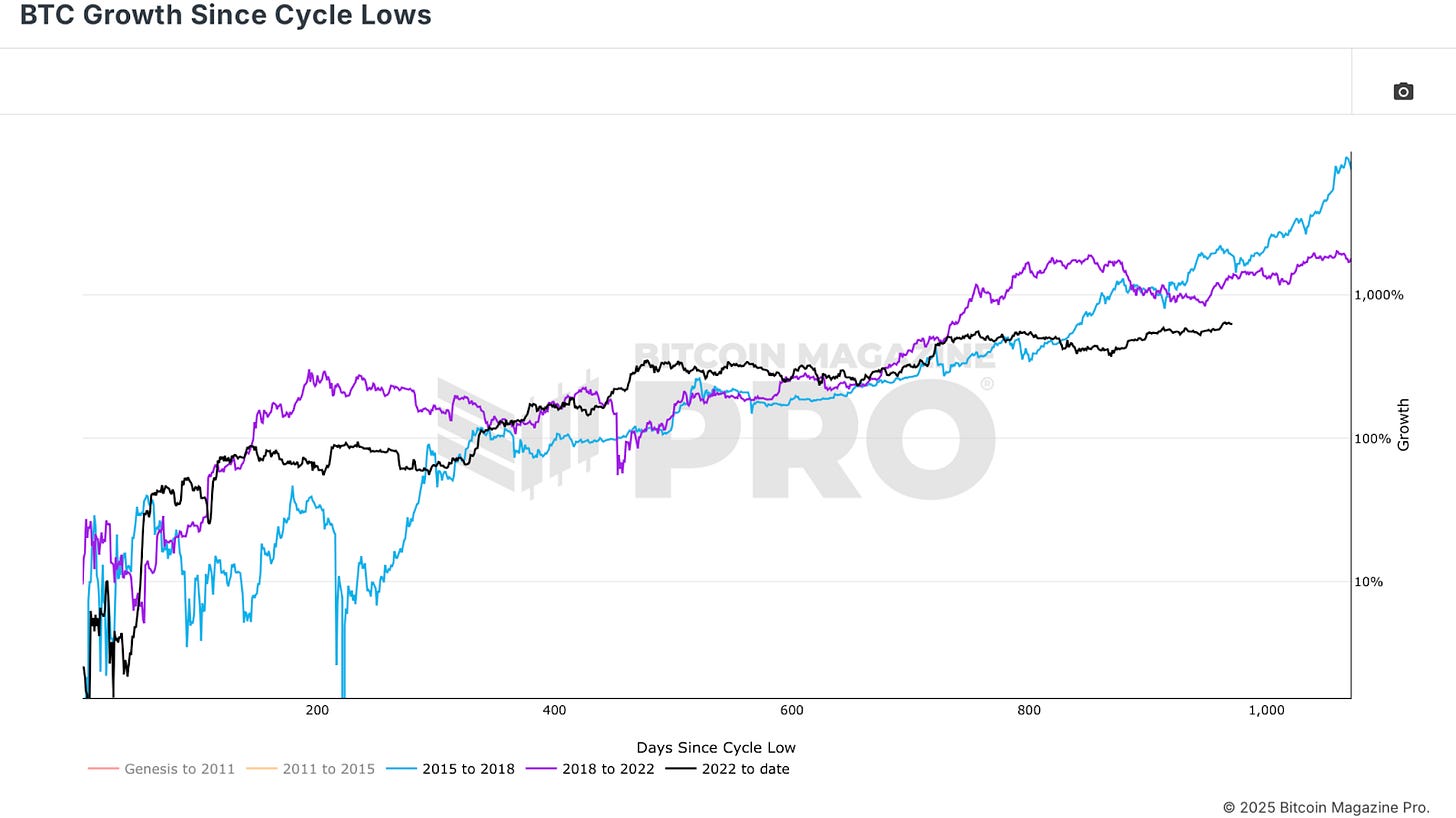
Viewing the Bitcoin Growth Since Cycle Low chart, we can see that we’re currently around 975 days into the ongoing cycle. For comparison, the 2017 bull market topped out 1,068 days after its cycle began, while the 2021 cycle peaked at 1,059 days. That places us potentially under 100 days from a peak if we’re following historical precedent.
Figure 1: The Bitcoin Growth Since Cycle Low chart positions the current bull market only 100 days from the two previous cycle peaks.
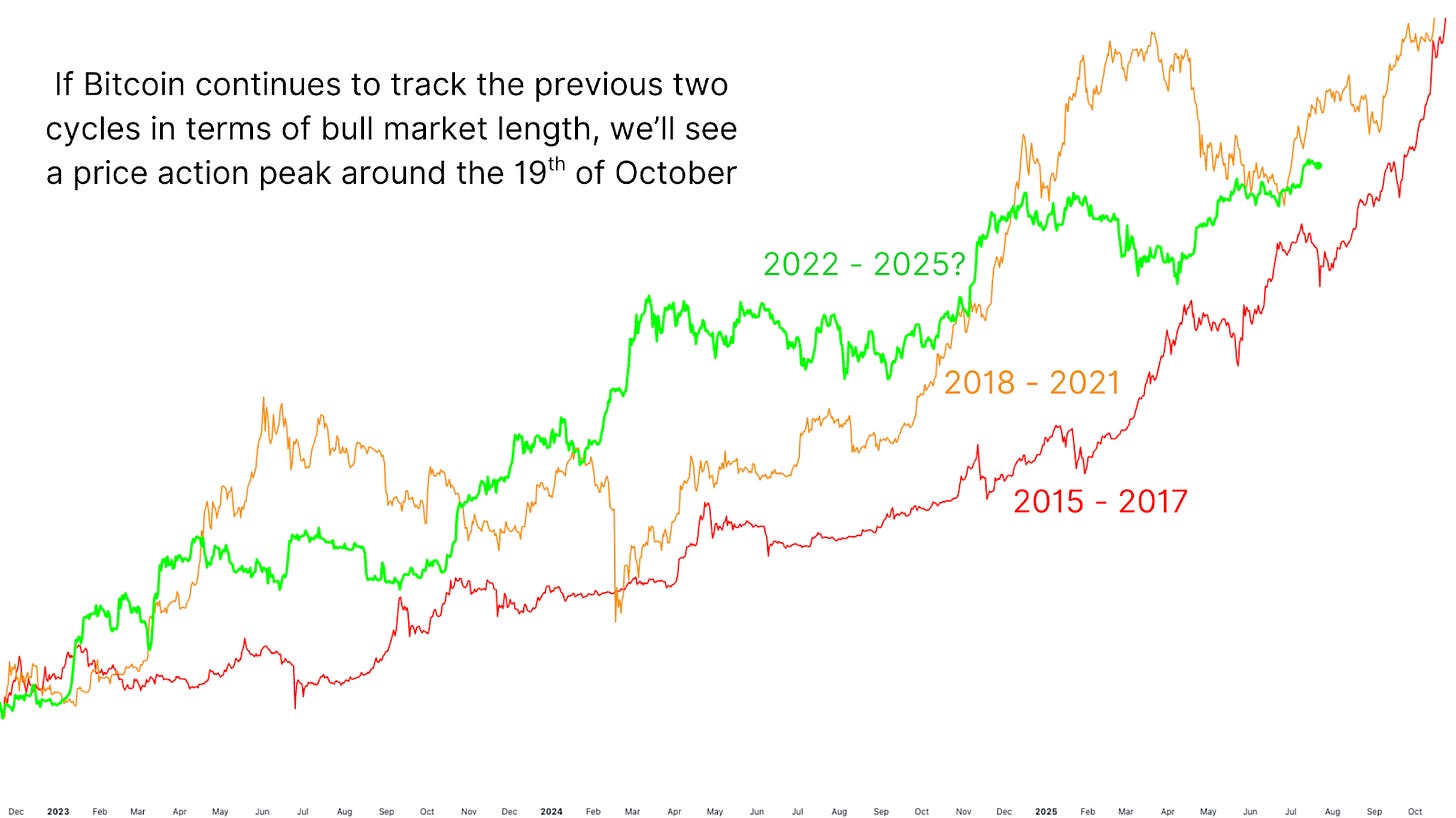
A deeper look into TradingView overlays, aligning both the 2017 and 2021 cycles with the current price action, both earlier cycles entered their parabolic “banana zone” around this same timeframe, resulting in explosive price increases. Averaging the timing between the two would indicate a potential peak around October 19th.
Figure 2: Applying the average duration of the previous two cycles would see October 19th as this cycle’s peak.
Is This Time Different?
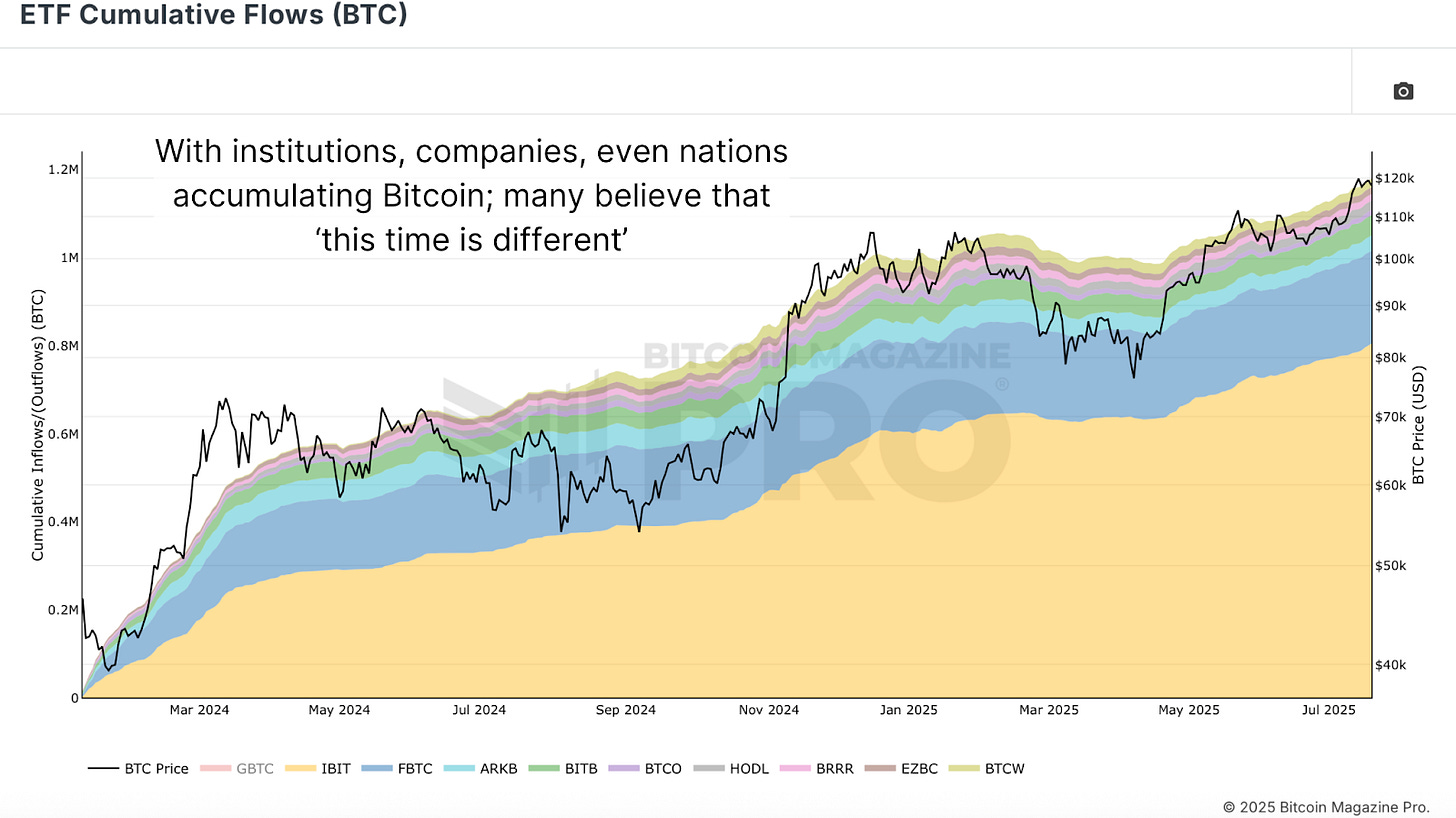
One major counterpoint to this historical view is the magnitude of recent Bitcoin ETF Cumulative Flows. Since January 2024, over 1.2 million BTC have been absorbed by ETFs, with a good portion of that unlikely to return to the market any time soon. This has dramatically altered the supply-demand balance.
In addition to ETFs, Bitcoin treasury companies are sitting on over 870,000 BTC, with that number growing daily. Sovereign holders also account for over 500,000 BTC, and we could still see national strategic reserves that would further tighten supply. When you add in coins held for over 10 years that may be lost (currently around 3.3 million total, so we’ll round down to a very conservative 1.5 million), the potential non-circulating supply exceeds 4 million BTC, or over 20% of the total circulating supply.
Figure 3: ETFs and other recent institutional BTC accumulations have radically altered market supply and demand dynamics.
Many argue that this cycle is unique due to ETF inflows and institutional adoption, but realistically, this sentiment has echoed in every previous cycle, yet each cycle has ultimately followed a similar trajectory. While current fundamentals are undeniably stronger, assuming a supercycle without hard data remains speculative. Until proven otherwise, history suggests that our traditional 4 year cycles should remain our base case.
October Peak?
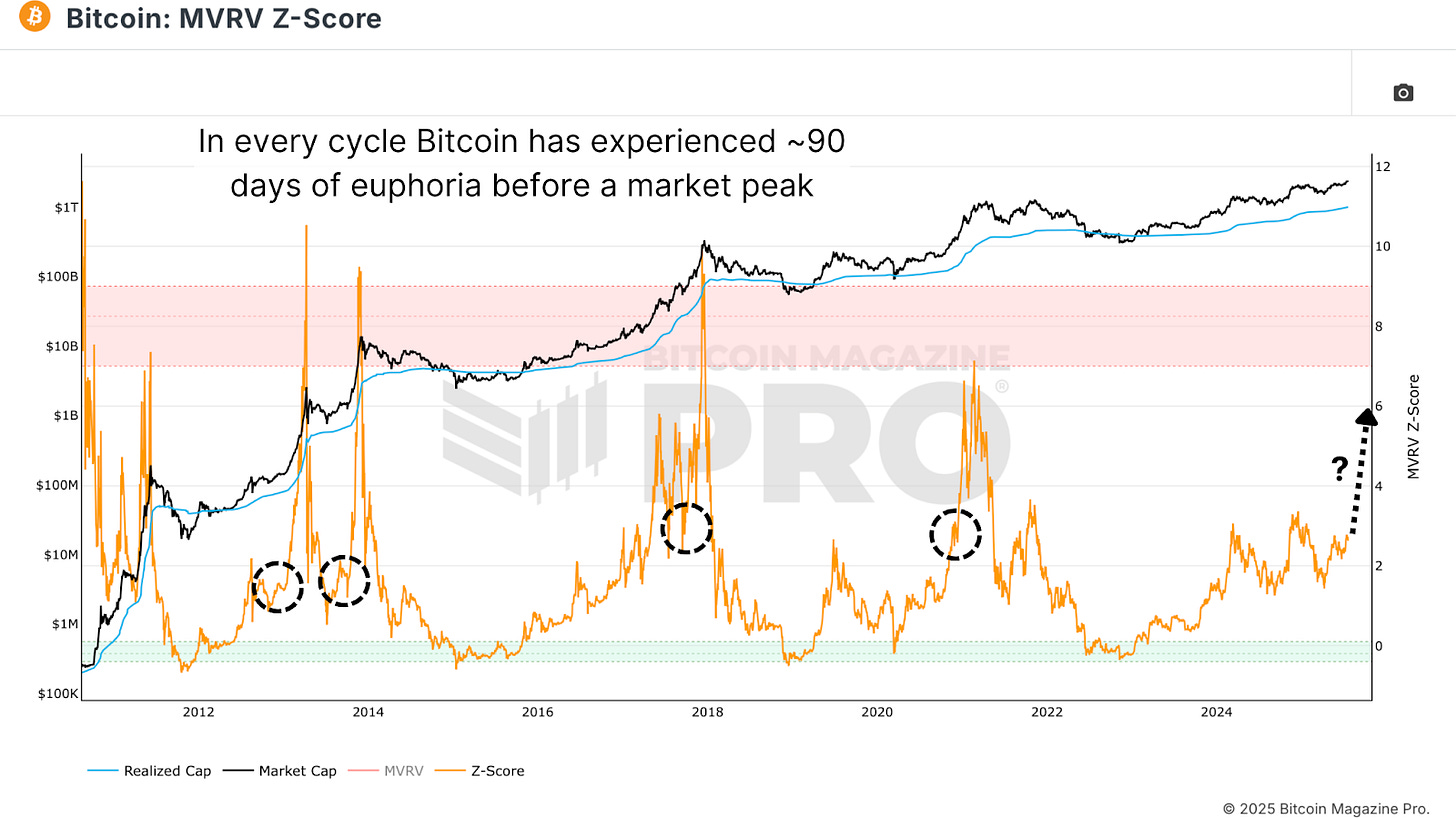
Let’s assume for a moment that the cycle does indeed top in October. Is such a sharp move even feasible? Absolutely. When Bitcoin crossed $10,000 in 2017, it doubled in just two weeks. Even this cycle, Bitcoin rallied close to 100% in under 100 days leading up to its $100,000 milestone. Following the ETF approval, BTC surged 80% in just 50 days. Once momentum builds, Bitcoin’s parabolic potential becomes reality fast, and when looking at the MVRV Z-Score, we can see the on-chain data backs this up with similar runups from similar data levels towards market peaks.
Figure 4: Historically, Bitcoin cycle peaks are preceded by 90 days of market euphoria, represented here by the rapid increase in the MVRV Z-Score.
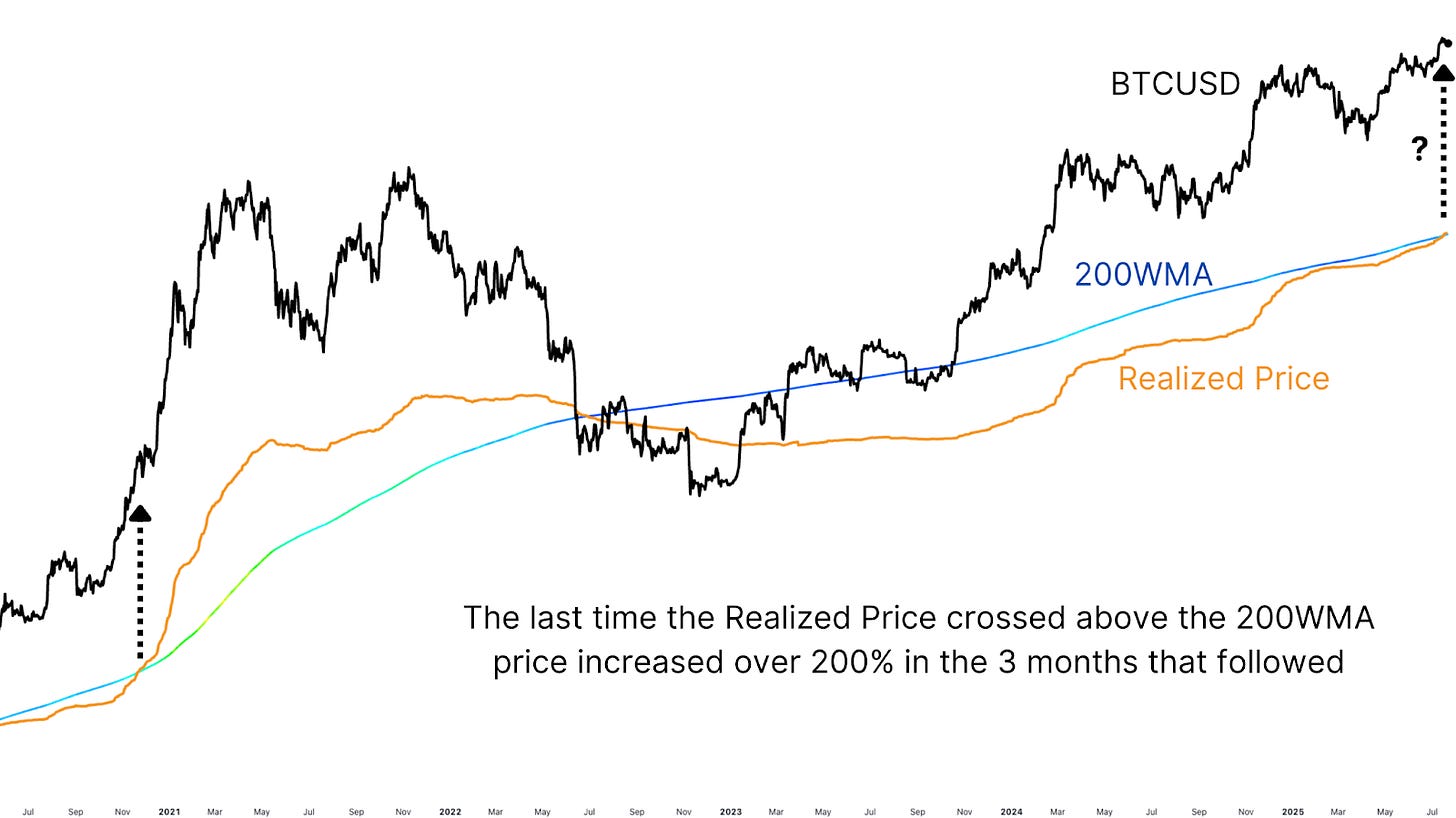
Zooming out further, the 200-Week Moving Average recently surpassed $50,000 for the first time ever. More importantly, Bitcoin’s realized price has crossed above the 200-week MA, a rare event that only occurred once before, in November 2020. Back then, BTC rallied by 212% in 90 days.
Figure 5: Realized Price recently crossed the 200-Week Moving Average for only the second time.
If we follow even half that trajectory, a 105% gain from current levels would place BTC near $250,000, again, right around mid-October. While it’s risky to base projections on a single historical instance, it’s interesting that this is once again occurring at a very similar stage of the cycle.
Conclusion
Every cycle carries whispers that “this time is different”. And while this cycle has plenty of reasons to believe that could be true, ETF inflows, institutional dominance, sovereign accumulation, etc, the data still points toward a cycle top sometime in Q4 2025. Could we blow past that and enter a true supercycle? Maybe, and I’d love to be proven wrong! But we’ll need evidence before assuming this narrative. For now, the historical cycle blueprint remains our most reliable guide.
For a more in-depth look into this topic, check out a recent YouTube video here: Why This Bitcoin Bull Market Might Have Less Than 100 Days Left
Matt Crosby
Lead Analyst - Bitcoin Magazine Pro
Bitcoin Magazine Pro
For more detailed Bitcoin analysis and to access advanced features like live charts, personalized indicator alerts, and in-depth industry reports, check out Bitcoin Magazine Pro.
Make Smarter Decisions About Bitcoin. Join millions of investors who get clarity about Bitcoin using data analytics you can't get anywhere else.
We don't just provide data for data's sake, we provide the metrics and tools that really matter. So you get to supercharge your insights, not your workload.
Take the next step in your Bitcoin investing journey:
Follow us on X for the latest chart updates and analysis.
Subscribe to our YouTube channel for regular video updates and expert insights.
Follow our LinkedIn page for comprehensive Bitcoin data, analysis, and insights.
Explore Bitcoin Magazine Pro to access powerful tools and analytics that can help you stay ahead of the curve.
Invest wisely, stay informed, and let data drive your decisions. Thank you for reading, and here’s to your future success in the Bitcoin market!
Disclaimer: This newsletter is for informational purposes only and should not be considered financial advice. Always do your own research before making any investment decisions.



Another bit of history that lends itself to a bump beyond the 100-day cycle is that BTC tends to do well in October before trading sideways until December. Either way, it is interesting to way. Thanks for posting.