By The Numbers: Rough Waters Ahead, But Bitcoin is Ready to Excel
Holder confidence and robust capital inflows permeate through the price and derivatives market. Bitcoin turns bullish as macro turns bearish.
Introduction
The bullish fundamentals we have been covering for months are starting to be represented in the price. This week's on-chain metrics show increased long-term holder confidence and robust capital inflows. Price metrics tick all bullish boxes with room to run to the upside. The derivatives market shows increased leverage and sophisticated risk management, suggesting potential for volatility. However, macroeconomic indicators are more bearish, with declining liquidity pointing to a potential deflationary recession. We are entering uncertain economic waters with a whole new kind of average investor. Retail investors remain absent, while institutional and long-term buyers dominate. This mix of bullish trends and economic headwinds sets the stage for a critical period in Bitcoin's market dynamics.
On-chain Metrics Indicate Cycle Continuation
Overall, this week's on-chain metrics indicate increasing long-term holder confidence and robust capital inflows, signaling a bullish outlook for Bitcoin's future price appreciation. They continue to signal a bullish sentiment in the Bitcoin market. All metrics are behaving as we would expect in the middle of a bull market at the end of a long-term consolidation, exactly what we have been forecasting for months.
The one exception to this general bullishness might be the Realized HODL Ratio, which uses a ratio of the Realized Cap HODL Waves between 1 week and 1-2 years. It decreased from last week, showing the realized price for the long-term holders moved up more than for the short-term traders. However, when taken in context of the 30-day move, it is still nicely positive. If we look at the chart below of this metric, you notice that a bottom was set on or about May 15th and the down tick is not significant. It also shows we are nowhere near a cycle top.
Investor Insight
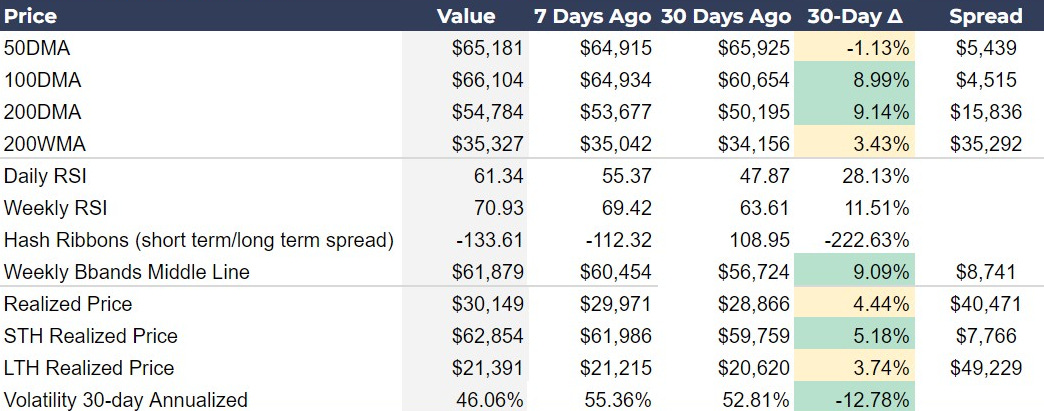
The Realized Price 30-day Change, which is a useful proxy for understanding the rate of capital inflows and outflows by tracking the average cost basis of Bitcoin, has risen strongly to 4.54%, a significant 103.26% increase from 30 days ago and is signaling cyclical price expansion. This is caused by robust capital inflows and growing investor confidence. Historically, this behavior occurs as price is about to make a very significant move.
Price Metrics
We are in the middle of a significant rally at the moment. At the time of writing, the price is up 1.5% on the day and up 5.8% on the week.
All moving averages are now upward sloping, with the 50-day completing its reversal, you can see it is positive on the 7-day change. Daily RSI has plenty of room to run if we continue moving up in price, and the weekly RSI is technically overbought on standard settings. However, historically for bitcoin, the weekly RSI should not be considered overbought until 80, so it too, has plenty of room to run still.
Hash ribbons are more negative this week, but it is important to remember that these are moving averages of hash rate. To get this difference, we subtract the 60-day moving average from the 30-day moving average. Even though the hash rate has been generally flat for the past couple of weeks, the base effect is keeping it below the long-term moving average for now. This should change rapidly over the next two weeks back to a positive difference and will trigger a buy signal. All other price metrics are calm, including the VIX, which has fallen below 50%.
Investor Insight
Potential for Volatility Expansion to the Upside: The convergence of all major moving averages (50DMA, 100DMA, and 200DMA) turning positively sloping, coupled with the decreasing 30-day annualized volatility, sets the stage for a significant expansion in volatility to the upside.
Derivatives
The derivatives market data this week indicates increased leverage and a complex sentiment among traders.
The Perps Funding Rate 7DMA Annualized has decreased slightly to 11.38%, down 1.92% from last week, but remains significantly higher than a month ago, showing slightly less leverage in perps than last week, but more than a month ago. While we usually see rallies starting from negative funding rates that is not always the case.
The Futures Annualized Rolling Basis over 3 months has increased marginally to 13.56%, reflecting higher expectations for future price appreciation and continued bullish pressure. The combination of a higher futures basis and a slightly lower funding rate says that this price is still attractive to buyers and traders have some room to add leverage. Futures are also telling us the carry trade is alive and well.
Meanwhile, the Options 25 Delta Skew for one month has become more negative, moving to -7.35%, down 4.51% from last week. This increase in negative skew might suggest that traders are hedging their long positions. They could be expecting potential downside risks or rejection at the ATH resistance.
Investor Insights
Potential for Volatility and Price Movements: The combination of increased leverage and hedging activity points to a market poised for significant price movements. Traders remain bullish, but are also preparing for potential volatility. The probability of sharp price swings has increased notably this week.
Macro and Miscellaneous Data Analysis
Our macro metrics this week are decidedly more bearish than last week, pointing to a building risk of a deflationary recession. Global M2 is rising, but not nearly enough to service new debts that are having to pay over 5% interest. This is squeezing the economy, as evidenced by recent disappointing retail spending numbers. Firms like Target and Walmart are cutting prices, and Kohl's posted a loss for Q1. Banks are also starting to feel the pressure, with the FDIC recently reporting that 63 banks are on the brink of insolvency.
In Central Bank Assets and Other Deposits and Liabilities (ODL), we can see the biggest decline in liquidity. Central banks are draining their balance sheets, currently at -3.55% YoY, but ODL is the canary in the coal mine here. This is a more narrow version of M2 that eliminates physical cash and money market funds, providing a more representative measure for liquid dollars in the economy. These continue to signal deterioration.
This week, we got the updated PCE numbers for April, which were unchanged from March. Additionally, the ISM PMI showed that the manufacturing sector's contraction has accelerated. Although the PMI for the service sector (not shown) expanded, beating expectations with a 53.8 print, manufacturing is the leading indicator of the two and carries more weight when considering a recession.
In our miscellaneous table, we see the DXY being relatively stable YoY with only a 0.19% change. The Mayer Multiple remains in accumulation territory for Bitcoin. Fund flows continue to be positive and will be very positive next week with yesterday’s single day inflow into the ETF of $887 million! The Bitcoin Miner ETF (WGMI) is also showing some nice gains, being up 14% in the last 30 days.
Investor Insights
The Coming Economic Squeeze: I’m getting increasingly concerned about the economic situation. I am not a perma-bear and have been typically bullish stocks, bonds and bitcoin for the last 18 months. However, the market appears to be deteriorating more rapidly and a real test for bitcoin is getting near. In general, I expect a recession to be positive for bitcoin as it joins the ranks of pristine collateral and safe haven assets, but the test will come with the initial crash into the recession.
Different Kind of Buyer: It is important to note that the average buyer of bitcoin right now are institutional investors, long term savers, corporate balance sheets and even pension funds through the ETF. These are people not likely to sell in panic during the onset of a recession. In the past, bitcoin trading and the average buyer was retail, who have much weaker hands. Retail is basically ignoring this bull market so far, and that is likely to continue.
This is important for two reasons. First, bitcoin will likely be less affected by fear and panic in a recession. Second, it is a sign the economy already has one foot in recession, as the average person doesn’t have the discretionary capacity to put money into Bitcoin or shitcoins.
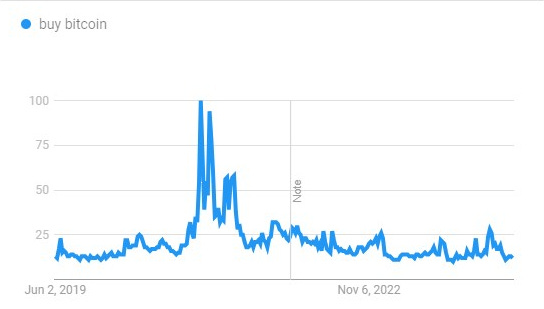
Source: Google Trends
As evidence that retail investors are almost non-existent right now in this market, I offer two charts. The first is YouTube traffic to major Bitcoin related channels. There was a slight increase with the approval of the Bitcoin ETFs but has since gone back to recent lows. The second is Google Trends for the term “buy bitcoin.” You can see that there is very little interest right now.
Bitcoin Magazine Pro™ Market Dashboard
The following is a screenshot of the Bitcoin Magazine Pro™ Market Dashboard. Click the image below ⤵️ to zoom in. 🔍
🔗 Download this week's Bitcoin Magazine Pro Market Dashboard in PDF format. ⤵️
If you liked this content please give a like and share! Comment below with your reactions to this post and any recommendations for future topics.
Thank you for reading Bitcoin Magazine Pro™, we sincerely appreciate your support!


