BM Pro Daily - Bitcoin’s Network Health
Active Entities Growth
In today’s issue, we’re covering the latest state, health and growing valuation of the Bitcoin network. As price faces another major cyclical all-time high drawdown seen several times over bitcoin’s lifetime, there are growing fundamentals under the surface that continue to set higher floors for valuation.
One of those key metrics is the growth of active entities on the network. Active entities are estimated clusters of addresses that are controlled by the same individual, institution or market participant. “Active” is defined as having received or sent bitcoin on that day. It’s derived from Glassnode’s data science and heuristics techniques so it’s an imperfect measure, but one that has done well at tracking growing demand over time. More on their methodology can be found here.
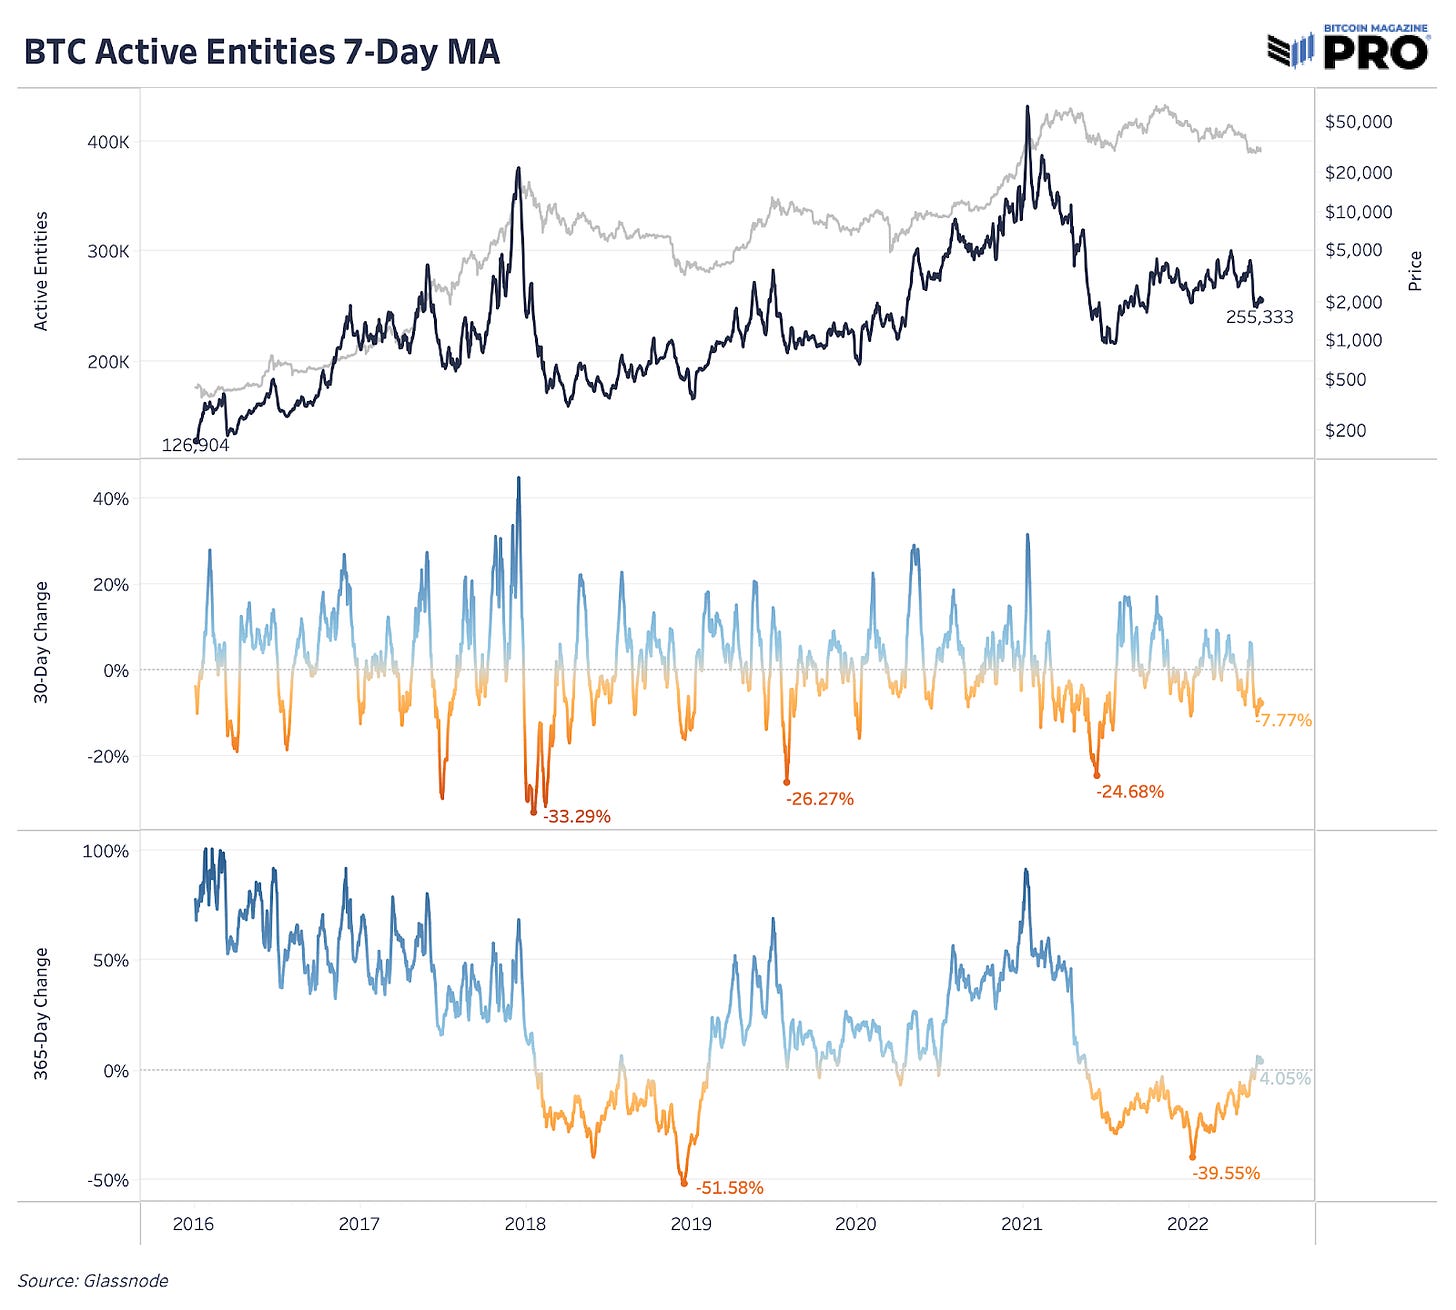
Looking at the chart below, active entities have more than doubled since 2016 — from 126,904 to 255,333. The past two cycle tops were preceded by elevated growth and spikes in active entities, reaching 376,549 and 432,636 in 2016 and 2021 respectively. As each cycle has printed new highs in active entities, the subsequent bottoms have seen a trend of higher lows. This paints a clear picture of the growing number of new “users” that are using Bitcoin’s on-chain transactions over time.
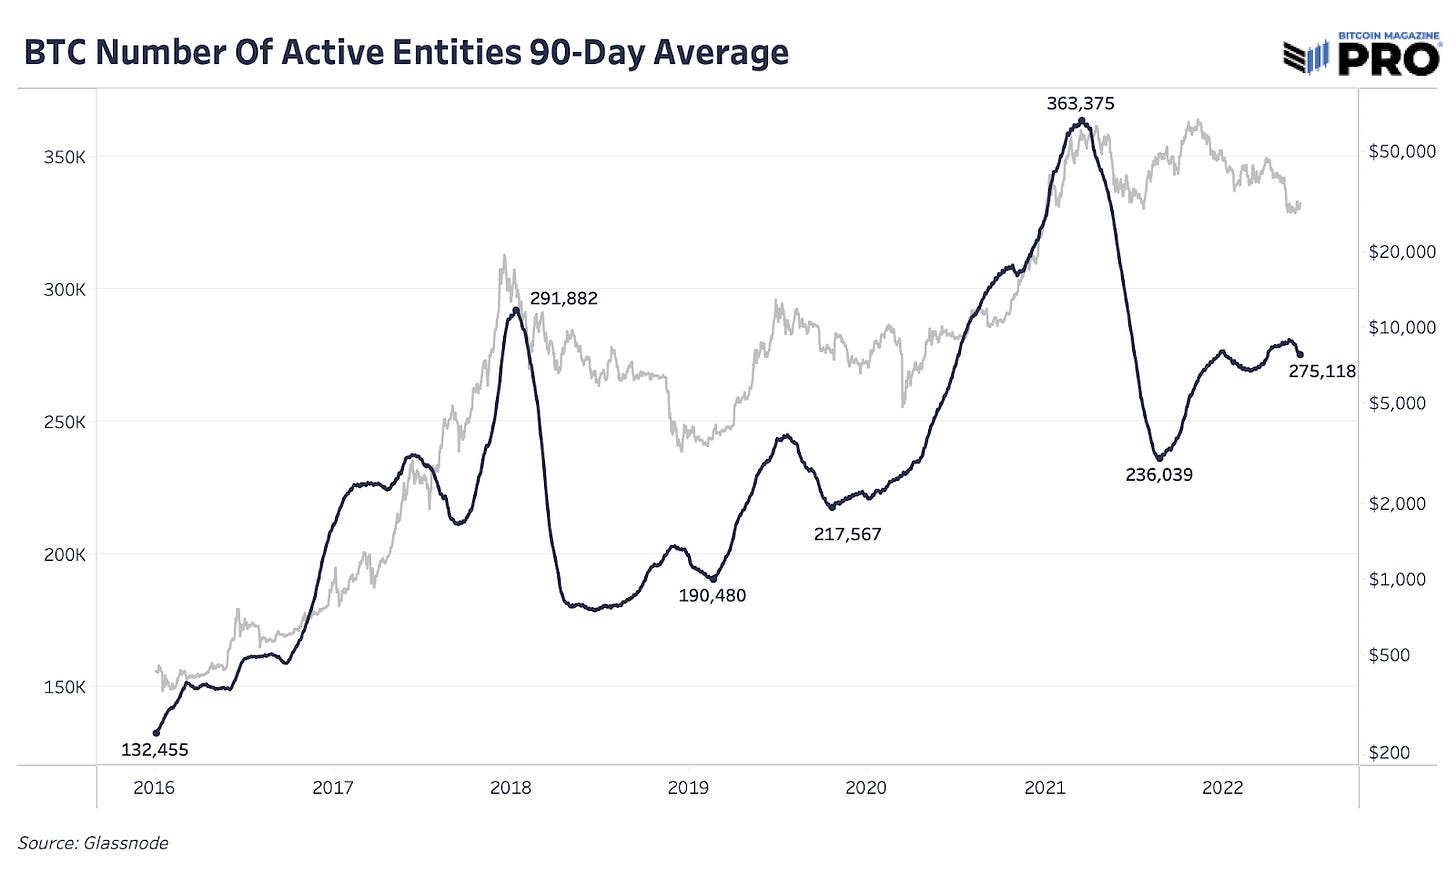
Another way to view this long-term growth trend is using the 90-day moving average rather than the 7-day MA.
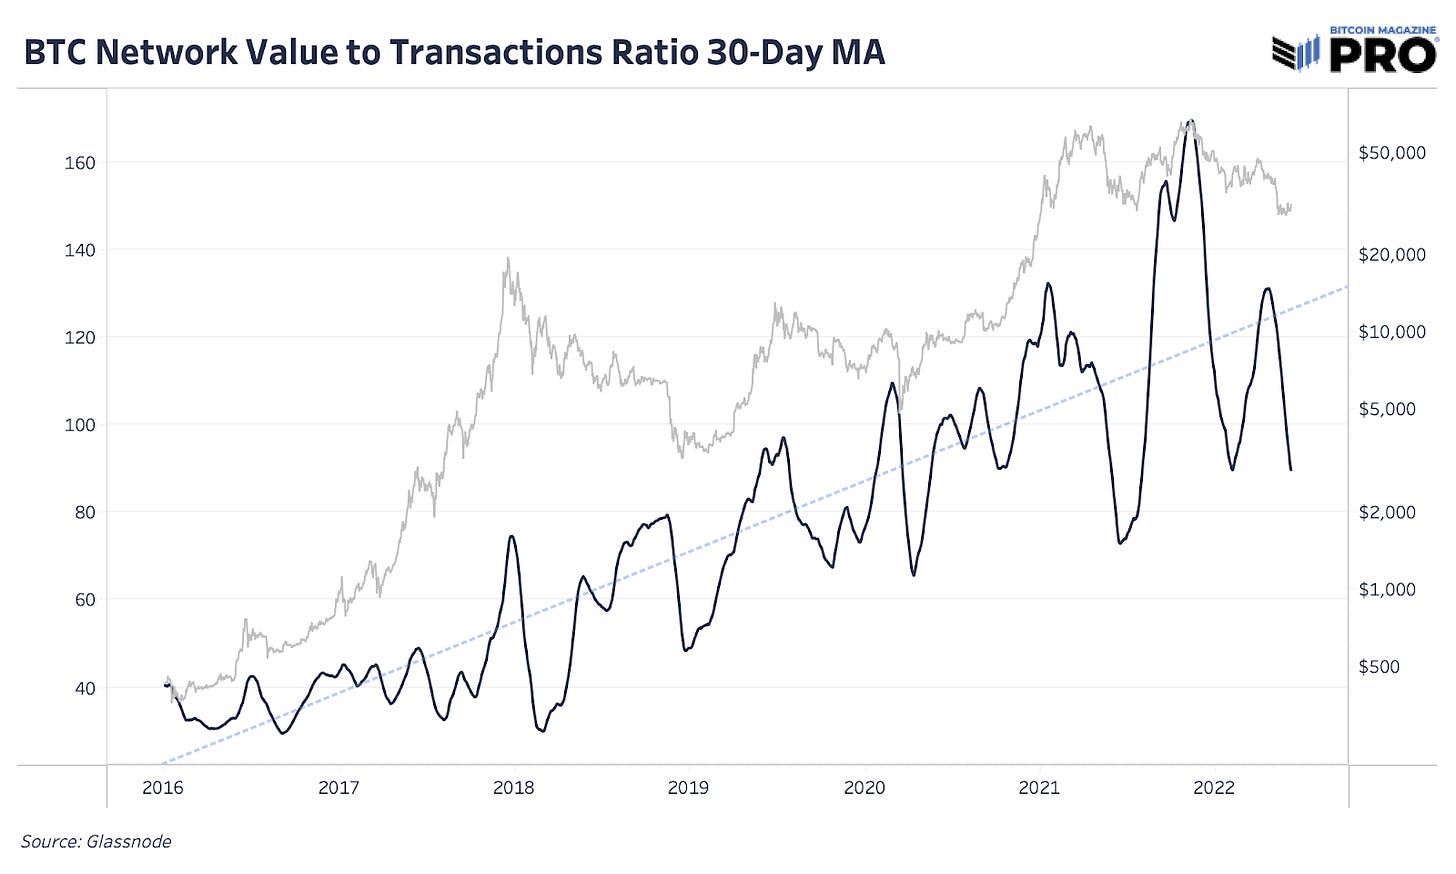
There are many attempts to derive and assess Bitcoin’s evolving market valuation. One of those useful attempts is the Network Value to Transactions (NVT) ratio which is a ratio of bitcoin’s USD market cap relative to the USD value of on-chain transaction volume, adjusted for internal entity activity. This can be thought of as similar to a P/E ratio as it tracks the market’s valuation of the Bitcoin network relative to each $1 moved on-chain.
Although volatile with price, Bitcoin’s NVT ratio shows a clear trend of the network becoming more valuable over time. Higher above-trend values indicate that price is overvalued while lower below-trend values show that price is undervalued. Since February, driven by larger macro forces unfolding, bitcoin has been undervalued on a fundamental basis when considering its on-chain transaction volume.
That said, there’s an increasing amount of bitcoin supply that can move hands off-chain, especially on exchanges, and the growing adoption of the Lightning Network which is not captured accurately in the NVT ratio below.
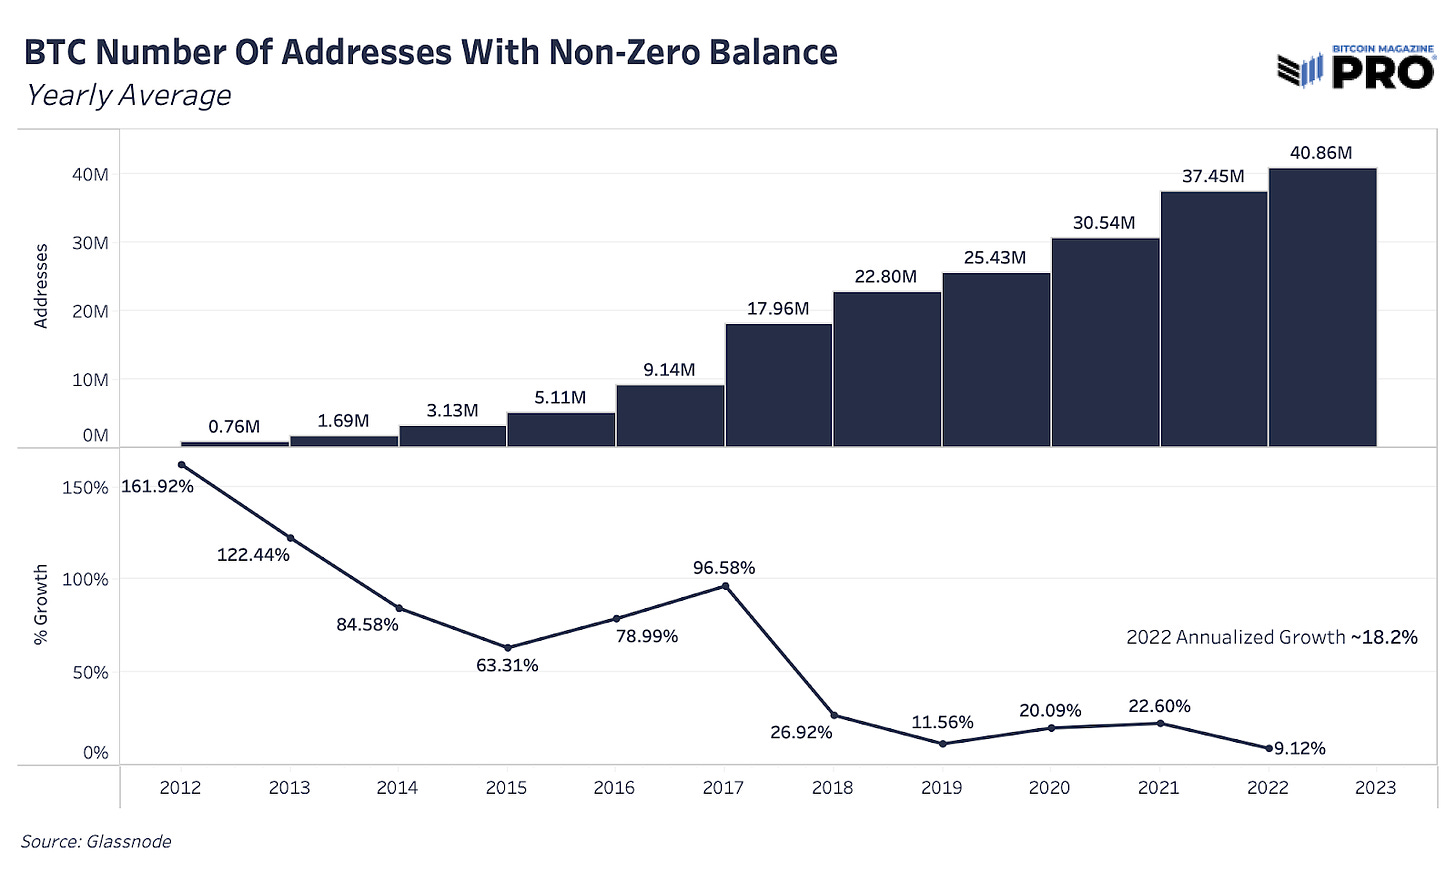
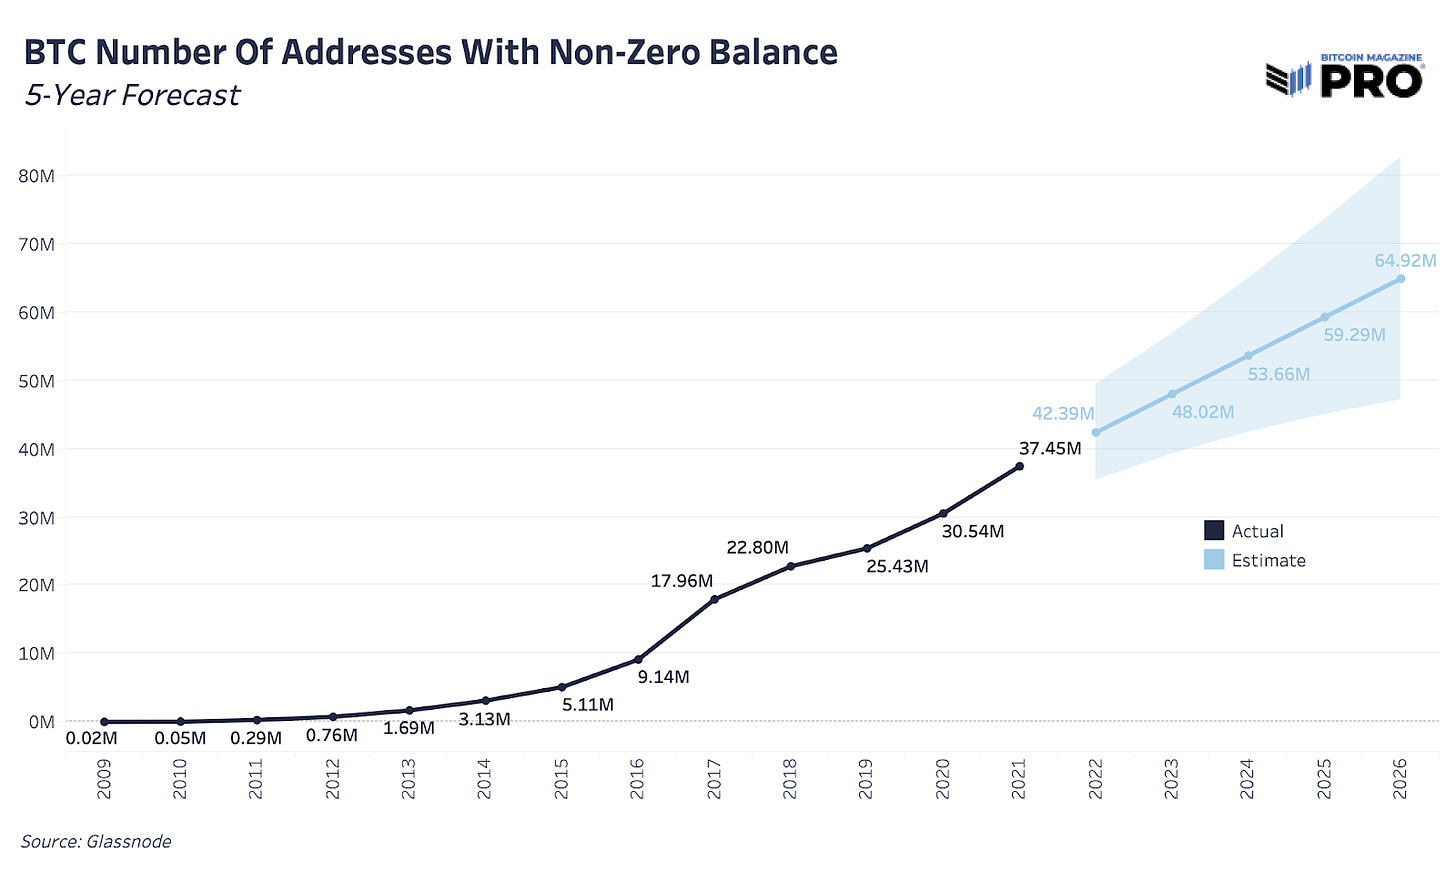
Next we have a view of the number of the Bitcoin addresses with a non-zero balance since 2012. Determining the number of Bitcoin “users” has always been a challenge which is why the entities metric were developed above. Although there are issues with just counting addresses (i.e., a user can have several addresses and a single exchange address can represent thousands of users), it’s a simple view to see Bitcoin’s growing adoption. The number of non-zero balance addresses continue to see annual double-digit growth with 2022 annualized growth at 18.2%.
Using a simple and conserative trend forecast model, non-zero balance addresses will nearly double by 2026 at this pace. That projection only assumes annual growth each year of 10-13%, well below the current trend. Effectively, this high-level view reflects Bitcoin’s S-curve adoption taking shape over time.
Lastly, it’s important to note that Bitcoin’s base layer usage is not entirely indicative of total network adoption, as increasingly users are onboarded to services and/or applications that don’t directly interact on the base layer for every transaction. Examples of these services include custodial exchanges such as Coinbase, where a user purchase doesn’t necessarily move bitcoin unless it is withdrawn.
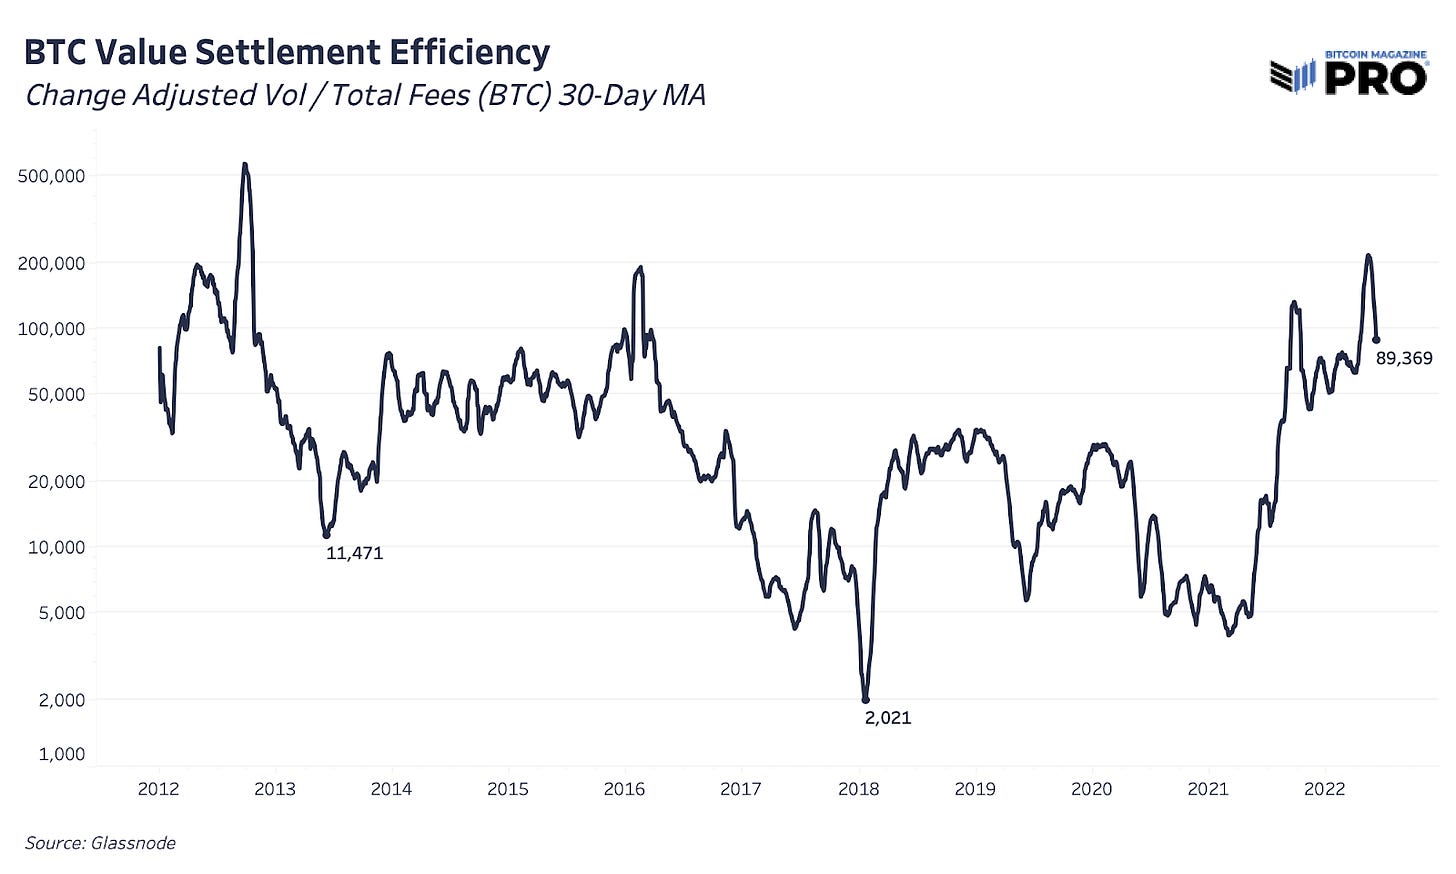
Another example is the increasing use of the Lightning Network by Bitcoin companies such as Strike, Cash App and River Financial (to name a few), which allow users to take custody of their bitcoin using the second-layer protocol. We highlight this point because it is very important to understand that Bitcoin is fundamentally a value settlement protocol at the base layer.
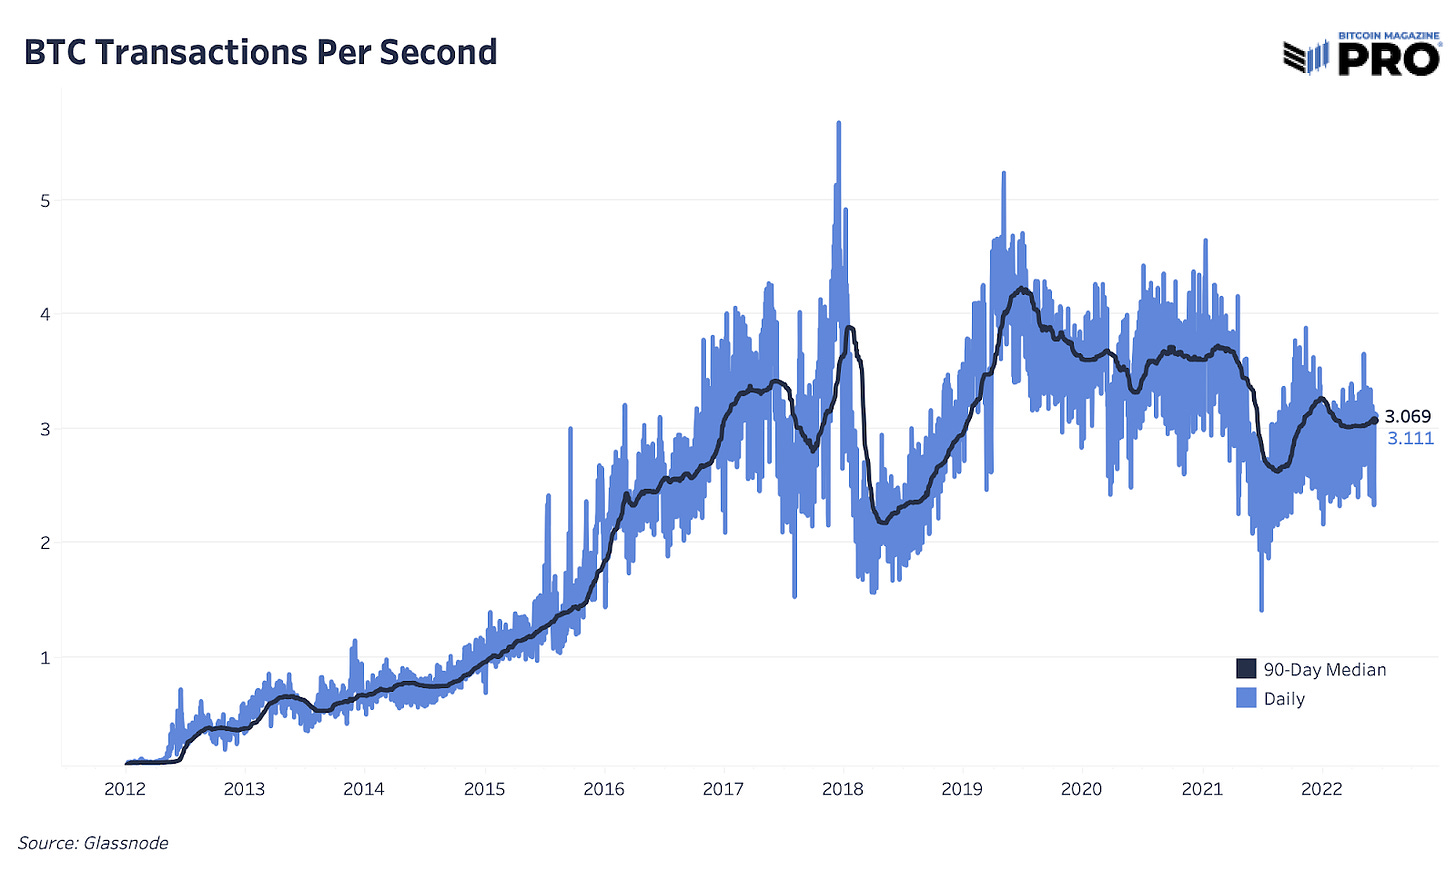
The rate/frequency of transactions, as skeptics and pundits alike often gleefully highlight, is not the important statistic to focus your attention on. As shown below, the base layer is limited in its throughput of transactions per second.
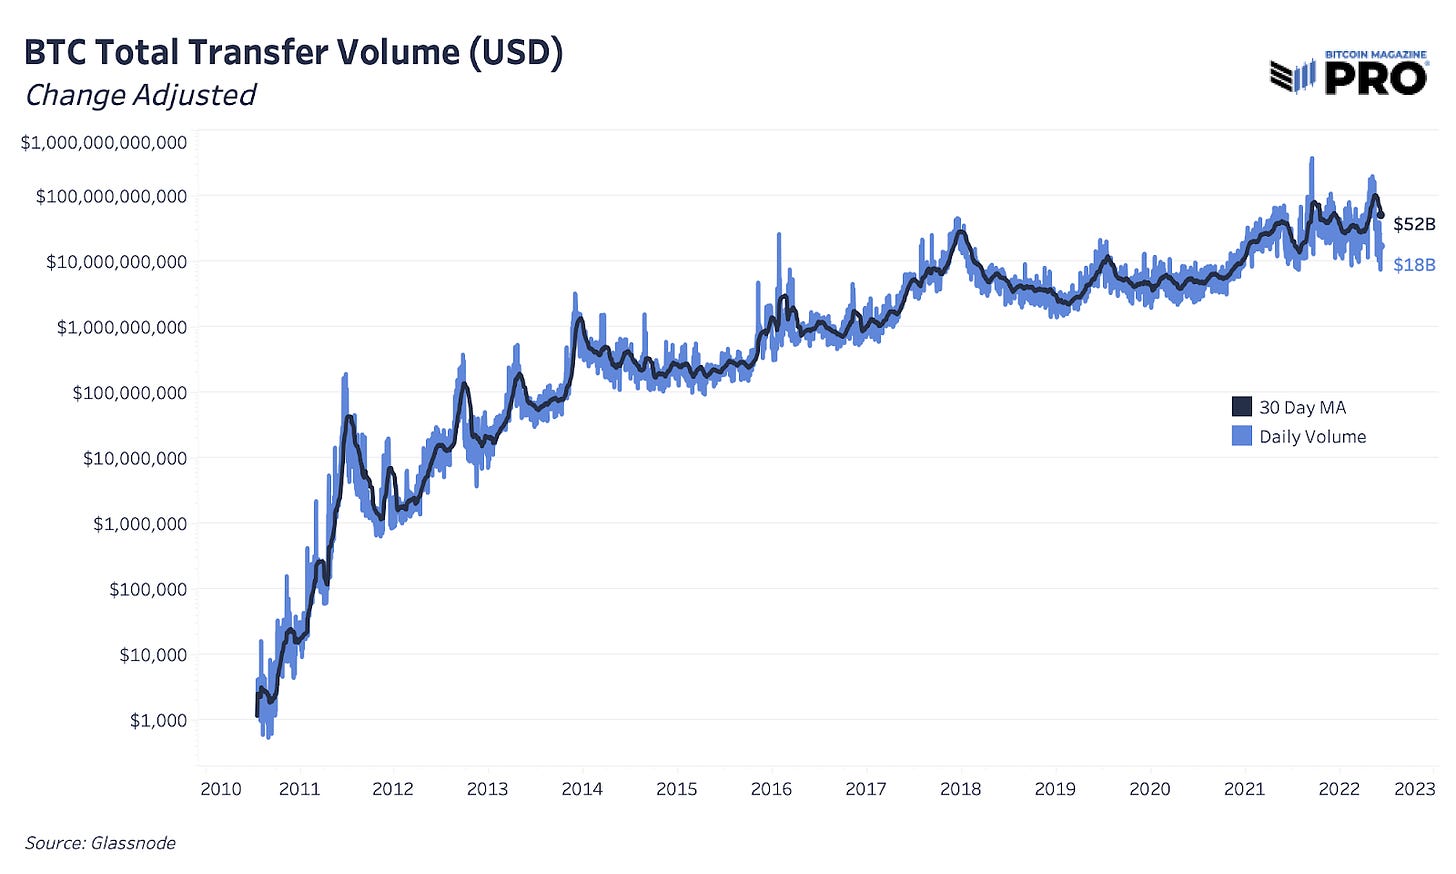
What is not limited by throughput is the amount of value that can be transferred across the protocol with unparalleled efficiency and the assurance of settlement finality. We have covered this concept in depth before, but it is worth noting again because of how misunderstood the concept is in most mainstream academic circles.
What’s important is that the Bitcoin network is operational 24/7/365 as the world’s most efficient and secure value-storage and settlement network to any user who wishes to utilize it.
The true signal is that the Bitcoin network transferred approximately $50 billion of value daily over the last month, in a completely decentralized and trustless manner for an average fee of 0.001012%. Said differently, over the last thirty days, $98,769 of value was transferred across the Bitcoin network for every $1 paid in fees, and there isn’t a person on planet Earth that could do anything to stop it.
While this is a calculated network average, we can also look at median figures to eliminate the skew of large transactions; this shows that $450 of value was transferred for every $1 paid in fees over the same period, which equates to a fee rate of 0.222%.
The elegance of the Bitcoin network, and its seemingly boring yet remarkable efficiency and resilience, is truly a technological marvel. Regardless of the thoughts or actions of bitcoin’s skeptics, blocks will continue to be mined, and the Bitcoin network will continue doing what it does as the world’s only truly decentralized monetary settlement network.


