


Bitcoin's Tipping Point: Gauging Market Direction with STH Behavior and Macro Forces
A Synthesis of On-Chain Signals, Price Patterns, Derivative Market Trends, and Global Economic Indicators Shaping Bitcoin's Investment Landscape


Bottom Line Up Front
On-chain metrics for Bitcoin suggest strong hodling, while the price metric's bullish moving averages indicate sustained market confidence across timeframes. The derivatives market implies short-term caution with a spike in the Perps Funding Rate, yet a medium-term bullish outlook reflected in Futures Rolling Basis and a less negative Options Skew. Macroeconomic indicators reveal complex dynamics, with shrinking global money supplies potentially signaling a shift away from central intervention, juxtaposed against positive manufacturing PMI, hinting at economic expansion. In sum, the interplay of these factors shapes a nuanced investment landscape for Bitcoin.
Market Sentiment and Holder Behavior: Bitcoin On-Chain Metrics
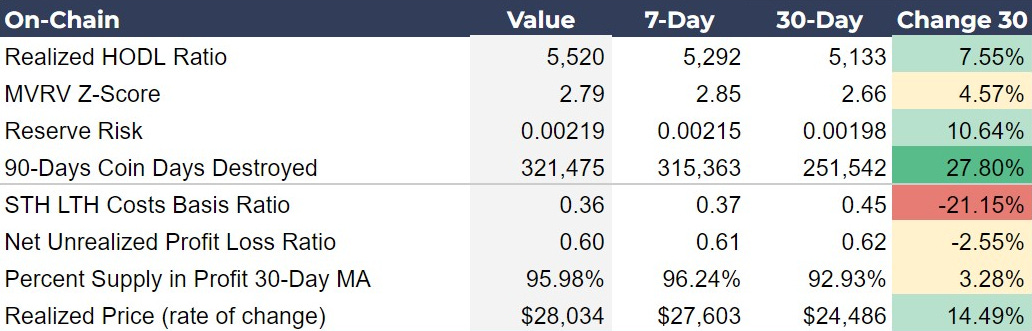
The on-chain metrics provide insights into investor behavior and market sentiment. The Realized HODL Ratio has increased by 7.55% over the last 30 days, indicating a rising propensity to hodl among the average investor. The MVRV Z-Score, which assesses market value against realized value, shows a slight decrease week-over-week (WoW), suggesting bitcoin momentum is not particularly overheated. MVRV being up over 30 days indicates we are still in the bull market trend. Reserve Risk has seen a significant rise of 10.64%, implying that the confidence among long-term holders (LTH) remains strong despite the price dip, and it is still a time for bull accumulation.
A noteworthy surge in 90-Days Coin Days Destroyed by 27.80% provides evidence of long-term holder selling activity around the previous ATH. The decrease in the STH LTH Costs Basis Ratio by -21.15% also suggests that LTHs are distributing coins to STHs. Our data does not capture today’s price action unfortunately, but these data indicate relatively elevated selling from LTH.
Investor Insights
Reserve Risk for Cycle Phases: Reserve Risk is clinging onto bullish territory still, indicating we have not exited the early accumulation phase of the cycle. The risk/reward for buying bitcoin is good on the bullish side.
Coin Days Destroyed and STH LTH Costs Basis Ratio: These indicators are telling a powerful story when taken alongside the Reserve Risk. LTHs are net sellers to STHs around the previous ATH. These newly minted holders might be the last ones to get in at such and attractive risk/reward.
Integrating Price Metrics and On-Chain Data
The alignment of the moving averages—where the shortest time frame (50DMA) is the highest and the longest time frame (200DMA) is the lowest—provides a classic bullish signal in technical analysis. This arrangement is often referred to as a "bullish alignment" and suggests that the market is in a strong uptrend across multiple timeframes. It indicates not just short-term optimism but also medium- to long-term confidence among investors.
The increase in Realized Price, coupled with the bullish MA alignment, suggests that the price at which Bitcoin is changing hands is rising, and investors are increasingly willing to buy at higher price points.
The RSIs are new this week. I added them to capture overbought and oversold conditions on the daily and weekly time frames. While the daily is fully recovered from its recent overbought condition, the weekly is still attempting to reset to enable the next bullish move higher.
Investor Insights
Support Levels: While today’s dip is not registered in our data due to the time of day our data is pulled, there are several important support levels to watch (chart below): the 50-day MA and horizontal support at $61,100. If those don’t hold, the STH Realized Price is at risk.
STH Realized Price is Critical: The STH Realized Price is a critical indicator of potential selling pressure. Since STHs have a higher propensity to sell than LTHs, if the spot price falls below that level, we should expect selling pressure to increase.

Derivatives: Short-Term Caution and Medium-Term Bullishness
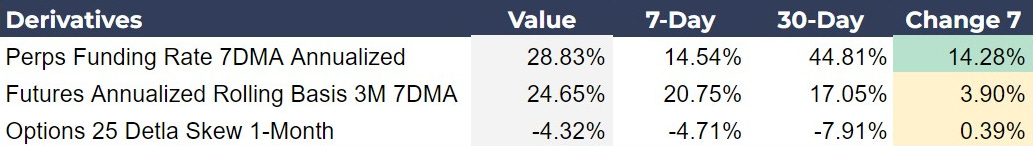
The derivatives market data for Bitcoin offers unique insights into trader sentiment and market expectations. The Perpetual Swaps Funding Rate (Perps Funding Rate) has seen a significant increase to 28.83% from 14.54% over the last seven days, meaning there were more longs coming into the market than shorts, adding fuel to this small dip we are experiencing in price.
Meanwhile, the Futures Annualized Rolling Basis for 3 months (3M) has also increased, moving up to 24.65% from 20.75%. That is despite the fact that we just rolled over into a new quarter. This rise signifies that the futures market is pricing in a bullish stance over the medium term, with traders expecting prices to climb higher than the spot market levels.
The Options 25 Delta Skew shows a slight shift towards less negativity, moving from -4.71% to -4.32%. A negative skew indicates that the cost of protective put options is higher than call options, suggesting that investors are willing to pay more for downside protection. The reduction in negative skewness implies a slight increase in bullish sentiment or decreased demand for downside protection.
Investor Insights
Interpreting Futures Basis and Options Skew Together: While the futures basis is increasing, indicating bullish sentiment for the medium term, the current corrective dip in the spot market may be tempering investor enthusiasm, as reflected in the continued negative options skew. This scenario suggests that while traders anticipate a recovery or further gains in the medium term, they remain cautious in the short term due to the ongoing correction.
Options Skew Approaching the STH Realized Price: As the spot price nears the STH Realized Price, we might expect the 25 Delta Skew to become more negative if traders anticipate further downside and seek to buy put options for protection. If the market perceives that a bottom is near or has been established, perhaps in the case that the STH Realized Price holds unbroken, we should expect a shift towards a positive skew.
Bitcoin and Macro: Mixed Signals
Interpreting macroeconomic metrics is difficult. For example, our data shows a shrinking Global M2 Money Supply by 0.48% year-over-year (YoY) and Global Central Bank Assets have declined by 4.69% YoY, as well. US Net Liquidity has also seen a YoY decrease of 0.96%. If we interpreted those metrics at face value, we’d have to then assume the economy is likely in the gutter, that we see just the opposite. Yesterday, March PMI was released showing a significant shift from under 50 to 50.8, now in expansion territory.
Perhaps, we are looking at these statistics all wrong. Maybe the fact that Central Bank Assets are declining is a sign that there is less monetary intervention, thereby benefiting the private sector. US Net Liquidity could be interpreted, not as decreasing liquidity, but as a normalization following previously excessive levels of liquidity.
Investor Insights
Everything is Good for Bitcoin: If the macro shifts bearish into recession, that is bullish for bitcoin as a safe haven. If macro shifts into expansion and growth, that is also bullish bitcoin as a risk asset.
Balancing Dollar Strength and Economic Expansion: While a strong U.S. dollar can exert pressure on Bitcoin prices, investors should balance this against signs of economic health around the globe. A stronger economy could foster increased investor confidence and risk appetite, potentially benefiting Bitcoin despite a stronger dollar.
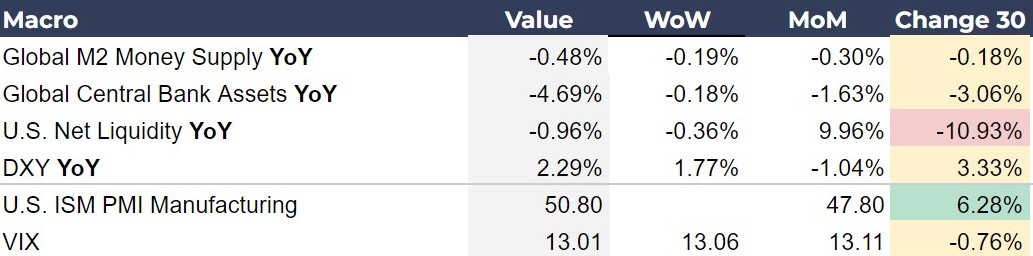
Chart of the Day
The mysterious “Mr. 100” continues their buying spree. There is mounting evidence that this entity is using Upbit, a South Korean exchange, but their identity remains unknown. Who do you think it is? Put your guesses in the comments below!


Source: Arkham Intelligence
Bitcoin Magazine Pro™ Market Dashboard
The following is a screenshot of the Bitcoin Magazine Pro™ Market Dashboard. Click the image below ⤵️ to zoom in. 🔍

🔗 Download this week's Bitcoin Magazine Pro Market Dashboard in PDF format. ⤵️
If you liked this content please give a like and share! Comment below with your reactions to this post and any recommendations for future topics.
Thank you for reading Bitcoin Magazine Pro™, we sincerely appreciate your support!
Not Financial Advice.
 | A guest post by
|
Is Mr 100 actually a company like Samsung