Bitcoin's Range Holds Steady as Analysts Anticipate the Next Market Catalyst
Examining BTC's price action, treasury adoption discussions, and long-term indicators.
Today’s headlines:
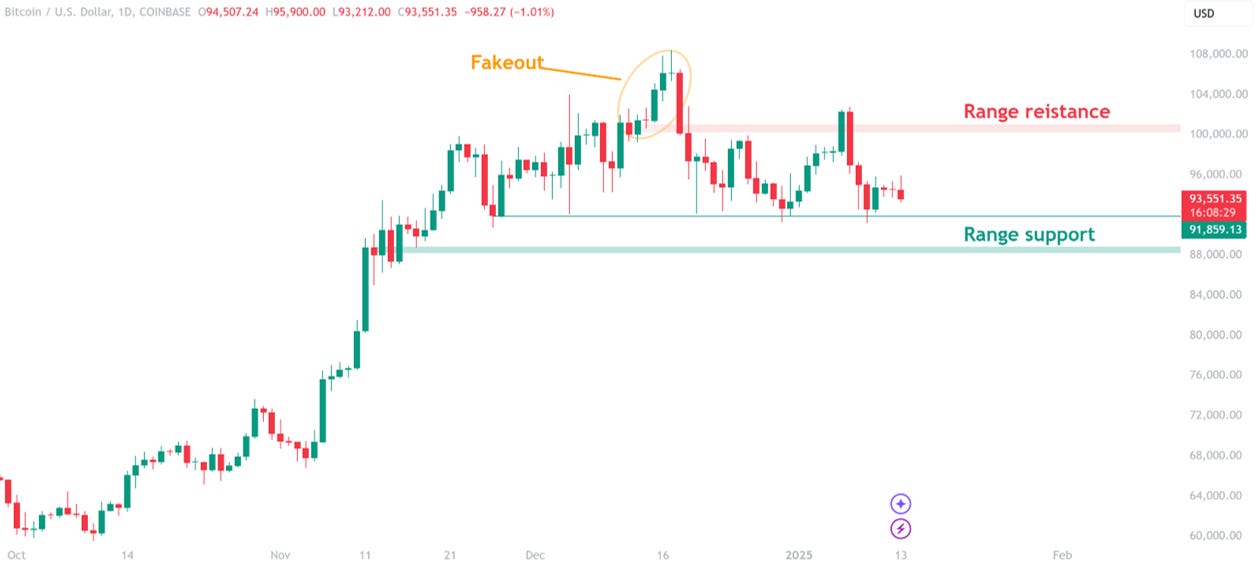
BTC remains in the range we outlined in last week’s Weekly Alpha.
New Hampshire to create Bitcoin Reserve for State treasury.
Grayscale Head of Research remains bullish Bitcoin despite Macro pressures.
In last week’s Weekly Alpha newsletter, we highlighted that a range was forming for $BTC price action. We speculated that $BTC would likely need to spend some time in the range before it could break out.
That has played out, with $BTC failing to break out and moving towards the bottom of the range, $89,000 - $91,000.
Figure 1: $BTC price action continues to range.
Patience may be required over the next week or two until there is a clear catalyst in the market to push $BTC up out of the range. Will the Trump inauguration on January 20th provide that boost for $BTC?
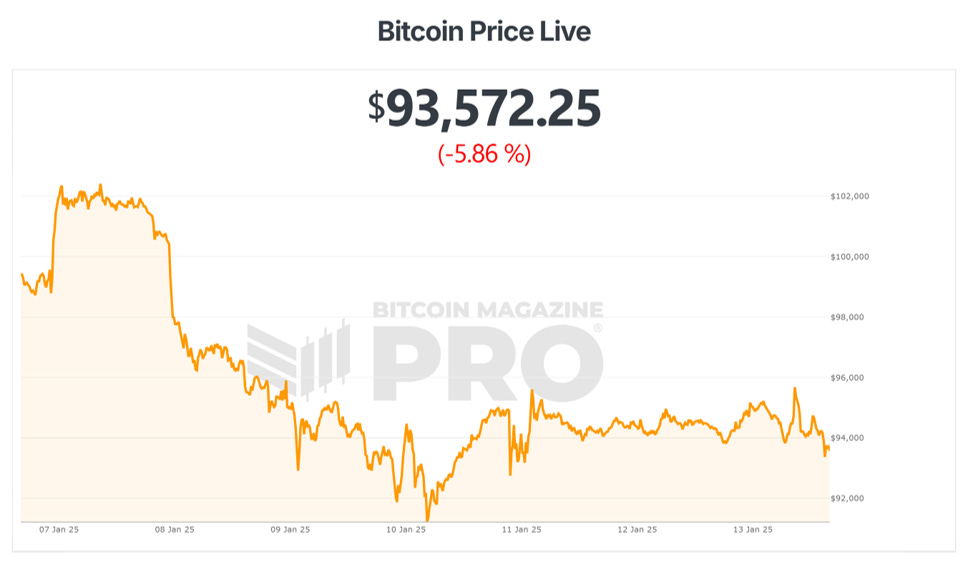
Over the past week, $BTC has reversed its previous week’s gains and is down -5.86%.
Figure 2: Bitcoin price is down over the past week.
This low-level volatility is likely to continue as $BTC spends time in the range outlined above.
However, many other indicators continue to show $BTC is in the middle of a bull market, so we do expect price to trend higher as we move deeper into 2025.
The Big Story
Is The Bull Run Over?
As $BTC price has been relatively lackluster in recent weeks, there have been many people questioning whether the bull run has already run out of steam at $100,000.
Let’s take a look at three charts that provide evidence to the contrary. They show that $BTC still has a lot further to run in 2025.
The Puell Multiple
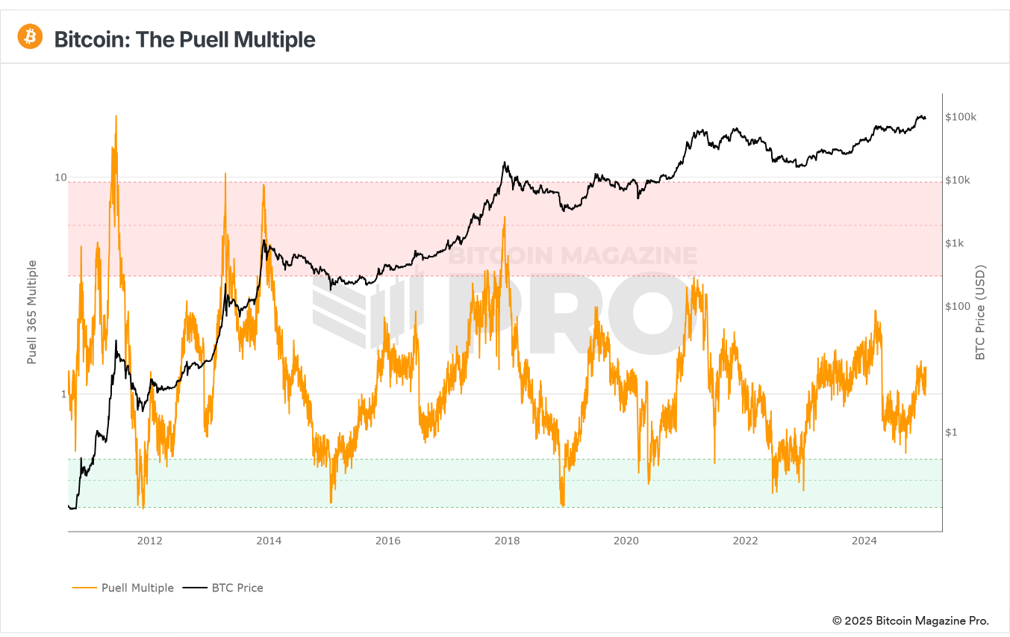
This metric looks at the supply side of Bitcoin's economy - bitcoin miners and their revenue.
It explores market cycles from a mining revenue perspective. Bitcoin miners are sometimes called compulsory sellers due to their need to cover fixed mining hardware costs in a market where price is extremely volatile. The revenue they generate can, therefore, influence price over time.
What’s happening now? The Puell Multiple has been trending up since September last year as higher prices help miners who survived last years’ halving. However, it still remains a long way from the overheated zone (red box), which has highlighted all previous cycle highs.
Figure 3: The Puell Multiple.
Pi Cycle Top Prediction
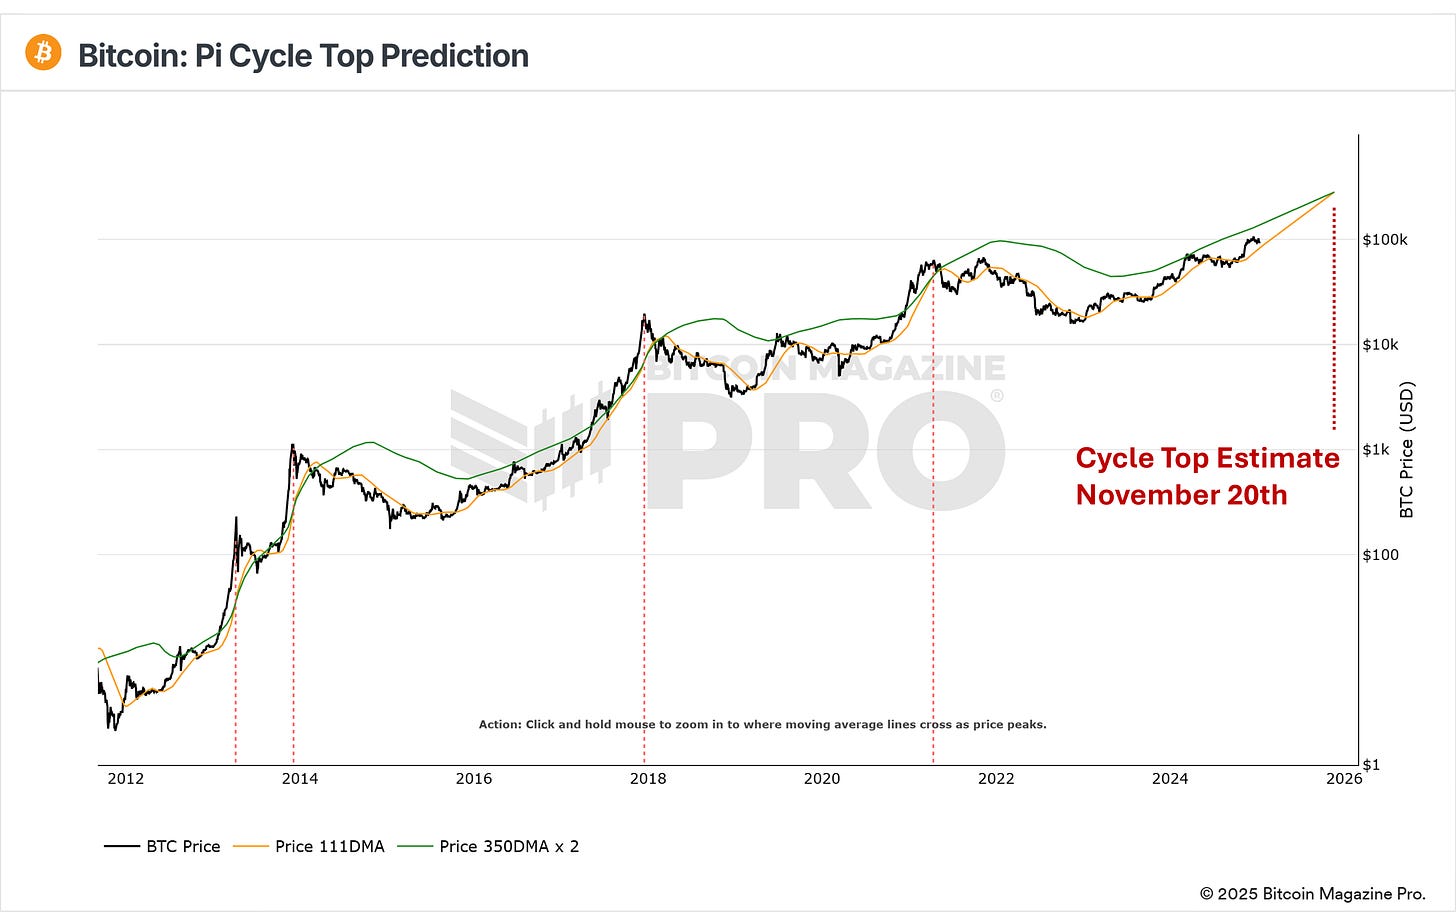
This indicator calculates the rate of change of two moving averages (350DMA x 2 and the 111DMA) over the past 14 days and projects that same rate into the future. The result is an estimate of when these two moving averages will cross.
Historically, when the moving averages cross, the price of Bitcoin has been within 3 days of a cycle top, signaling a potential market reversal.
While there is no guarantee that the Pi Cycle Top will work again this cycle, we do expect the moving averages to move significantly closer together before the bull cycle ends. With the combination of Institutional investment plus retail investment this cycle, there is strong potential for $BTC to rapidly move higher in 2025.
Figure 4: The Pi Cycle Top Prediction indicator.
The Pi Cycle Top Prediction tool is currently estimating November 20th for the cycle top.
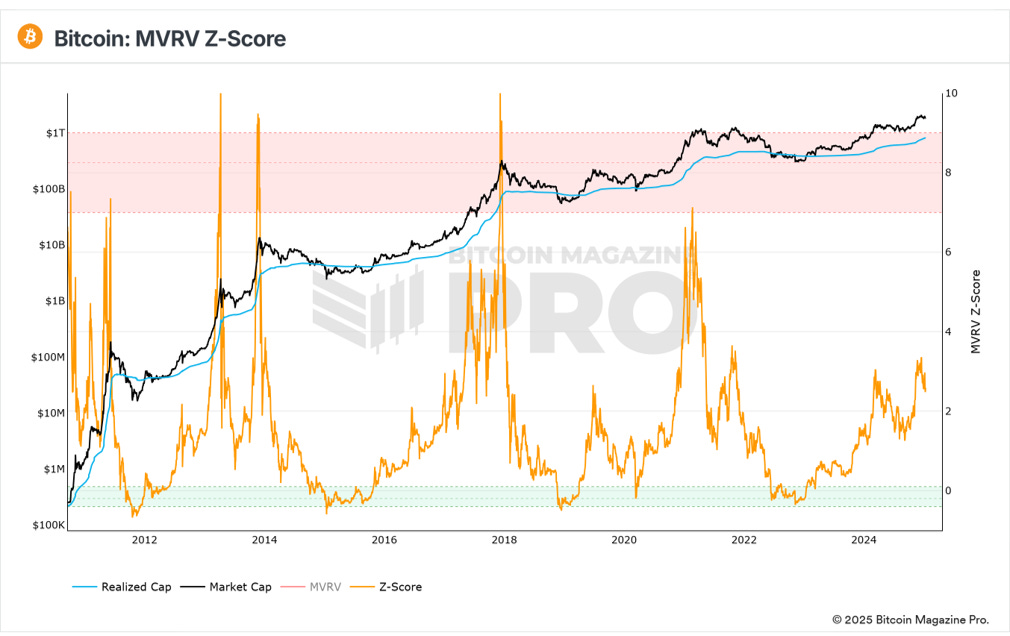
MVRV Z-Score
MVRV Z-Score looks at differences between the Market Value of Bitcoin and the Realized Value. The Realized Value is the average cost basis of all bitcoins.
So in essence, this chart is asking the question: “When is the current price of Bitcoin extremely different to the average price that everyone purchased their bitcoin?”.
Those extremes occur when the MVRV Z-Score (orange line) moves into either the green or red bands. Entering the red band has historically marked a cycle top.
Figure 5: MVRV Z-Score.
Currently, the Z-Score is only 2.57. That is a long way from previous cycle highs where the Z-Score has always exceeded a score of 7.
So for now there remains significant evidence in the data to suggest that this bull run still has a lot further to go. We may just need to be patient for a while until a catalyst causes the market to heat up again for the next leg of the bull run.
Bitcoin Magazine Pro subscribers get full access to these charts, alerts for when they hit key levels, as well as our published versions of them on Tradingview. To access, sign up here.
Bitcoin Magazine Pro Team.
Bitcoin Magazine Pro
For more detailed Bitcoin analysis and to access advanced features like live charts, personalized indicator alerts, and in-depth industry reports, check out Bitcoin Magazine Pro.
Make Smarter Decisions About Bitcoin. Join millions of investors who get clarity about Bitcoin using data analytics you can't get anywhere else.
We don't just provide data for data's sake, we provide the metrics and tools that really matter. So you get to supercharge your insights, not your workload.
Take the next step in your Bitcoin investing journey:
Follow us on X for the latest chart updates and analysis.
Subscribe to our YouTube channel for regular video updates and expert insights.
Follow our LinkedIn page for comprehensive Bitcoin data, analysis, and insights.
Explore Bitcoin Magazine Pro to access powerful tools and analytics that can help you stay ahead of the curve.
Invest wisely, stay informed, and let data drive your decisions. Thank you for reading, and here’s to your future success in the Bitcoin market!
🎁 Special Offer: Use Code: BMPRO For 10% OFF All Bitcoin Conference Tickets
Disclaimer: This newsletter is for informational purposes only and should not be considered financial advice. Always do your own research before making any investment decisions.




FELICES Y GRACIAS BITCOIN``S RANGE PRICE
FRELICES BITCOIN S RANGE