


Bitcoin Market Weekly Analysis - Mar 5 2024
Deciphering Bitcoin's Bull Run: A Deep Dive into On-Chain and Derivative Markets


Congrats everyone on the new ATH! Let’s see what we can learn from our Market Metrics Dashboard about this move and near term price trajectory.
The analysis of Bitcoin's on-chain metrics, price metrics, macroeconomic environment, and derivatives market reveals a comprehensive view of bitcoin’s current landscape. On-chain data shows strong holding by long-term investors, suggesting confidence in Bitcoin's value. However, there are several metrics that indicate volatility might be near. Macroeconomic indicators highlight a generally favorable environment for Bitcoin. Derivatives markets present bullish sentiment with increased hedging for downside risk.
On-Chain Metrics: A Strategic Analysis
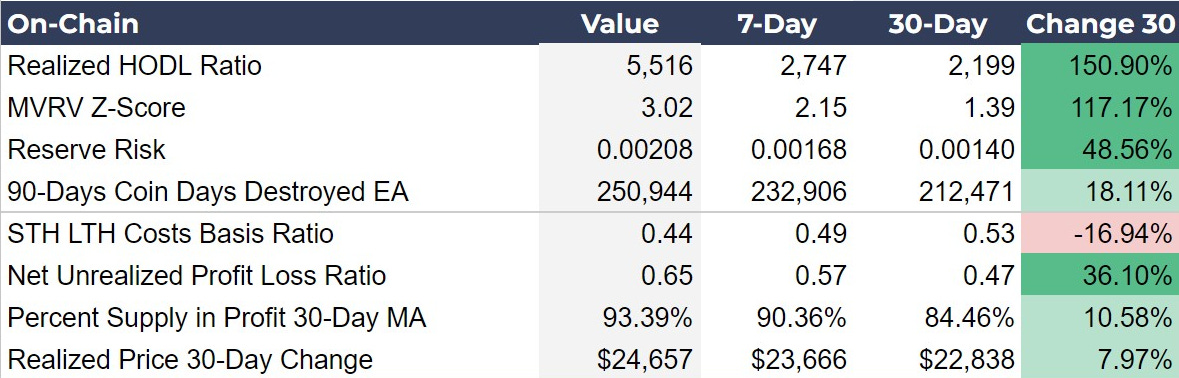
Long-term holders' strong retention rates, signaled by the high Realized HODL Ratio, reflect a bullish sentiment towards Bitcoin's future. Conversely, the elevated MVRV Z-Score hints at potential overvaluation risks, urging investor caution. Minor increases in selling pressure are noted through Coin Days Destroyed, yet this does not overshadow the long-term holder's confidence, as shown by the low Reserve Risk. Furthermore, the dip in the STH LTH Costs Basis Ratio suggests reduced selling motivation among short-term holders, contributing to potential market stability.
Key Insights
Long-term Holder Conviction: The high Realized HODL Ratio indicates strong retention by long-term holders, suggesting a bullish outlook on Bitcoin's value and stability, which could be a positive signal for investors considering the long-term potential of Bitcoin.
Overvaluation Warning: The increased MVRV Z-Score points to potential overvaluation, advising investors to exercise caution and consider the risk of a market correction, especially if planning short to medium-term investments in Bitcoin.
Market Stability Factors: The low Reserve Risk and the decreasing STH LTH Costs Basis Ratio imply high confidence among long-term holders and reduced selling pressure from short-term holders, potentially leading to market stability and making it an opportune moment for investors to assess their position in Bitcoin.
Navigating Bitcoin Price Metrics
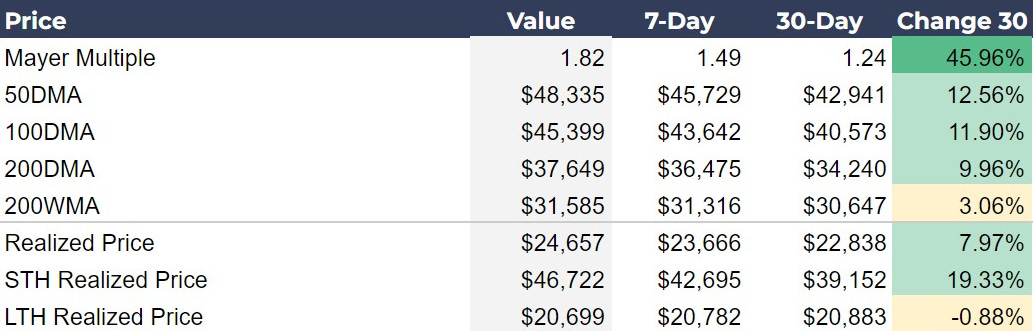
Currently, the Mayer Multiple stands at 1.82, illustrating a robust bullish trend without veering into speculative bubble territory, as it remains below the 2.4 mark. This indicates a market exuding confidence and growth, yet not overly speculative based on historical standards. The daily moving averages—50DMA, 100DMA, and 200DMA—show a consistent uptrend, reinforcing the bullish sentiment across short to long-term horizons. Similarly, the 200-week moving average (200WMA) reflects long-term stability and growth, aligning with the general market optimism.
Bitcoin's recent price milestone, surpassing its previous all-time high of $69,000, aligns with these metrics to signal a market with strong momentum. However, the nuanced view provided by the Mayer Multiple offers a strategic perspective for investors: the market is in a phase of significant growth, yet not at the point of speculative excess. This balance provides a fertile ground for informed investment decisions, where understanding these metrics can guide strategies in navigating Bitcoin's dynamic market landscape.
Key Insights
Balanced Market Sentiment: The Mayer Multiple at 1.82 indicates a balanced market sentiment for Bitcoin, positioned between the speculative bubble threshold and a prime buying zone, signaling cautious optimism for investors.
Confirming Bullish Trends: The upward trajectory in the 50DMA, 100DMA, and 200DMA underscores a strong bullish trend, reinforcing confidence in Bitcoin's ongoing market strength and potential for sustained growth.
Current Macroeconomic Landscape
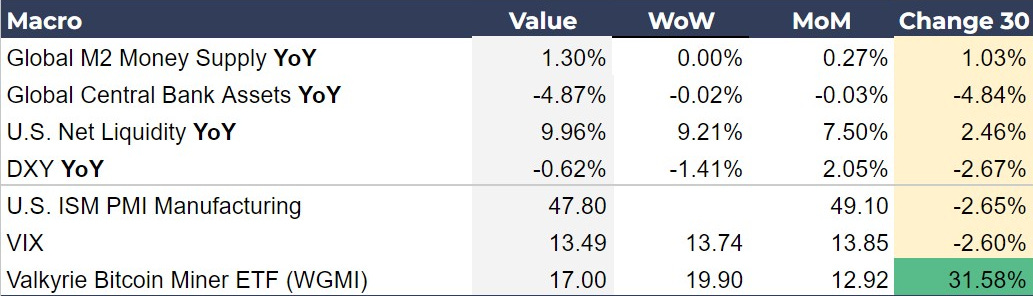
The macroeconomic data provides a crucial backdrop for understanding the current Bitcoin bull market, highlighting a mixed but generally favorable environment for alternative assets like Bitcoin. The moderate growth in the global M2 money supply indicates an increase in liquidity, potentially driving investors towards Bitcoin as a hedge against potential inflation or currency devaluation. Additionally, the contraction in global central bank assets points to a tightening monetary policy, which might affect risk asset sentiment but also underscores Bitcoin's appeal as a decentralized asset.
The manufacturing sector's health is an indirect indicator, yet it provides context on the broader economic climate. A contracting manufacturing sector might lead to increased investor caution across markets, potentially affecting risk asset appetites, including Bitcoin. However, given Bitcoin's nature as a non-traditional asset, it may still appeal to investors looking for alternative investments, especially in times of economic uncertainty.
Key Insights
Moderate Liquidity Growth: The global M2 money supply's growth suggests an increase in global liquidity, potentially making Bitcoin more attractive as a store of value in an environment where investors may seek protection against potential inflation or currency devaluation.
U.S. Liquidity and Dollar Trends: The substantial increase in U.S. net liquidity coupled with a slight weakening of the U.S. dollar could bolster Bitcoin's appeal, providing a favorable investment backdrop for the cryptocurrency amidst broader financial system trends.
Manufacturing contraction: The U.S. ISM PMI Manufacturing index indicates a larger contraction in February vs January. This is a hidden variable that could hint at slowing and a possible recession, which will pull out bitcoin’s deflation hedge attributes.
Insights into Price Volatility and Trader Sentiment
The Bitcoin derivatives market data provides critical insights into the prevailing market sentiment and expectations for Bitcoin's price movement. The noticeable increase in the Perpetual Contracts Funding Rate suggests that long traders are paying a massive premium to maintain positions. This could imply an anticipation of continued price increases, although it is also a huge red flag of heightened risk of volatility, as high leverage can lead to rapid market movements in response to price changes. Similarly, the rise in the Futures Annualized Rolling Basis suggests that traders expect Bitcoin's price to climb higher, as they are willing to pay more for futures contracts than the current spot price.
The Options 25 Delta Skew presents a negative value, indicating a market perception that the likelihood of a significant price drop is higher, the market is leaning pessimistic. This skew in option pricing reflects investors are willing to pay more for downside protection, or a bearish or cautious sentiment. Collectively, these derivatives market indicators suggest risk is shifting toward having a correction to the downside.
Key Insights
Expensive Long Perpetuals and Futures: The increased perpetual contracts funding rate and futures rolling basis indicate a willingness to pay a premium but also higher leverage and lower time preference.
Cautious Sentiment in Options Market: The negative options 25 Delta Skew signifies a cautious or bearish market sentiment, with investors showing a preference for downside protection, indicating concerns about potential price declines.
Market Prepared for Volatility: All three signals from the derivatives market imply that the rally is approaching volatility and correction, with risk to the downside with significant hedging.
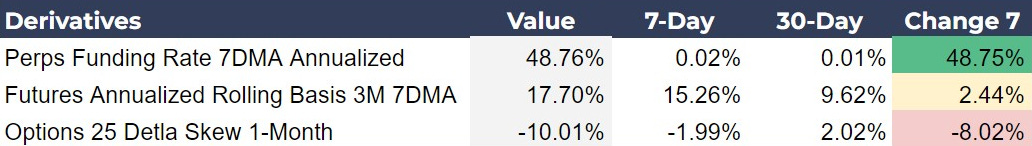
Chart of the Day
Bitcoin Mayer Multiple goes back in history to Bitcoin Legend Trace Mayer. It is not an unknown metric in traditional finance, but was adapted to bitcoin’s unique cycle pattern. A reading of 2.4 is a warning of a major top to a speculative cycle. It would require a rapid rally to $90,000 not giving the 200 DMA time to adjust in order to hit the 2.4 threshold. In other words, we are a long way from a cycle top.
Also, interesting is the 50 DMA of the Mayer Multiple. As you can see in 2016-2017, it provided a nice level to return to before continuing on the next leg higher. The reverse can be seen in the bear market of 2021-2022. Recently, again the 50 DMA has proven to be a significant level of support in this early bull market.

Conclusion
Strong holding patterns among long-term investors and a bullish tilt in futures suggest strong optimism about Bitcoin's price trajectory. However, the caution echoed by the negative options skew, rising MVRV Z-score and the nuanced macroeconomic backdrop, including liquidity concerns and monetary policy shifts, hint at a possible correction and downside risk. While the momentum is obviously positive, the derivatives market underscores a preparedness for volatility, reflecting a blend of confidence and caution among investors.
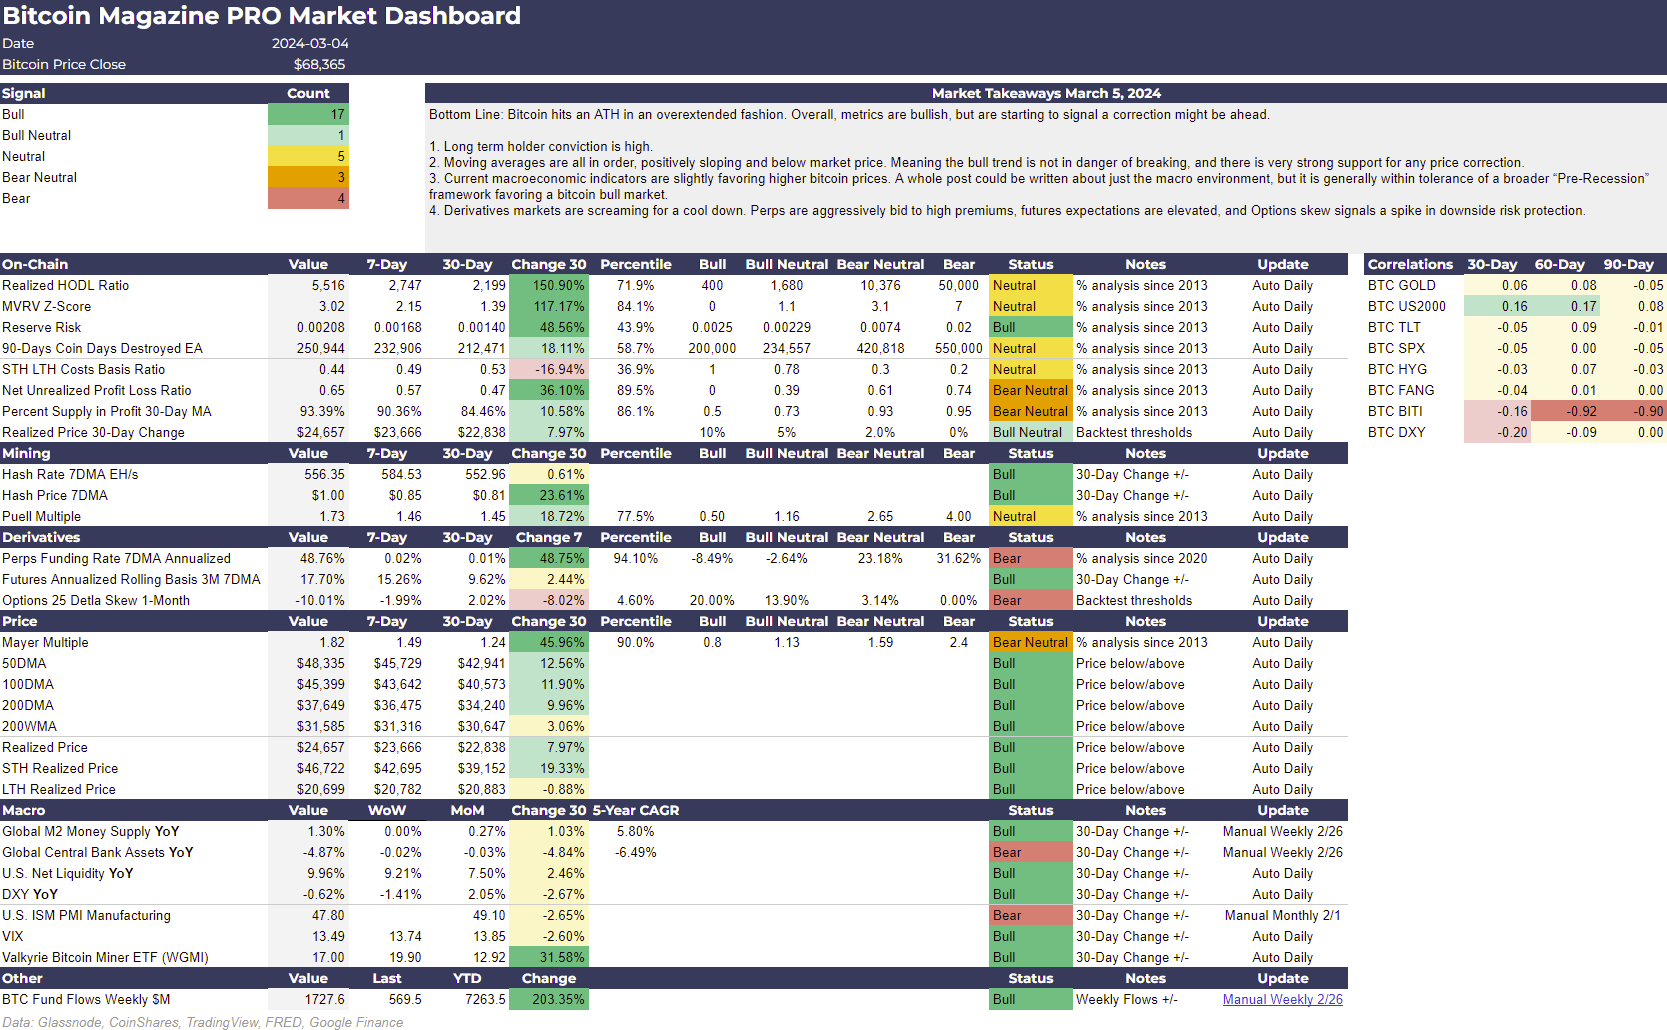
Bitcoin Magazine Pro™ Market Dashboard
The following is a screenshot of the Bitcoin Magazine Pro™ Market Dashboard. Click the image below ⤵️ to zoom in. 🔍
🔗 Download this week's Bitcoin Magazine Pro Market Dashboard in PDF format. ⤵️
Thank you for reading Bitcoin Magazine Pro™, we sincerely appreciate your support! Please consider leaving a like if you enjoyed this piece. As well, sharing goes a long way toward helping us reach a wider audience!
Not Financial Advice.
 | A guest post by
|
My best guess is that we don't correct very much, but instead consolidate around $62k for a week or two, then shoot past $70k.