Bitcoin Market Weekly Analysis - Feb 21 2024
What are On-chain Metrics and Fundamentals Saying About Bitcoin's Current Uptrend and Market Sentiment.
General Bitcoin Landscape
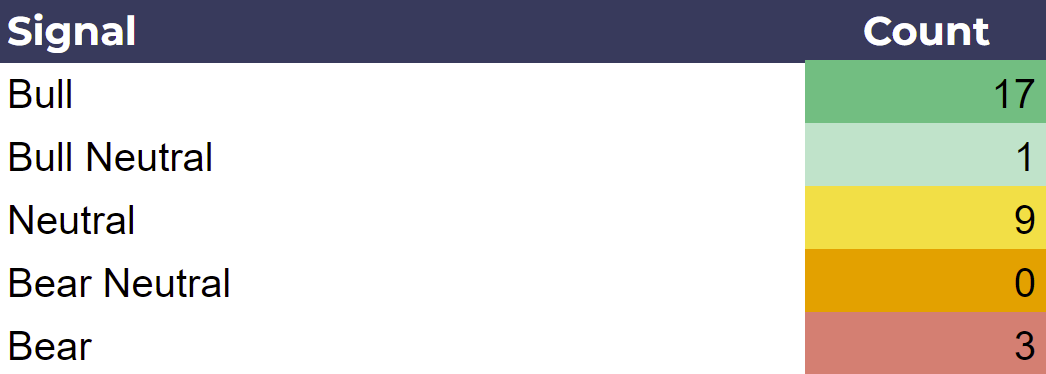
The past three weeks have been a whirlwind in the Bitcoin market. Our dashboard has noted a shift from 12 Bullish to a dominant 17 Bullish indicators, alongside a dip from 7 to just 3 Bearish signals. This turn of tides echoes the market's progression from the nascent stages of a bull run into a robust mid-cycle.
The On-Chain Dynamics
Bullish Sentiment is in the Air
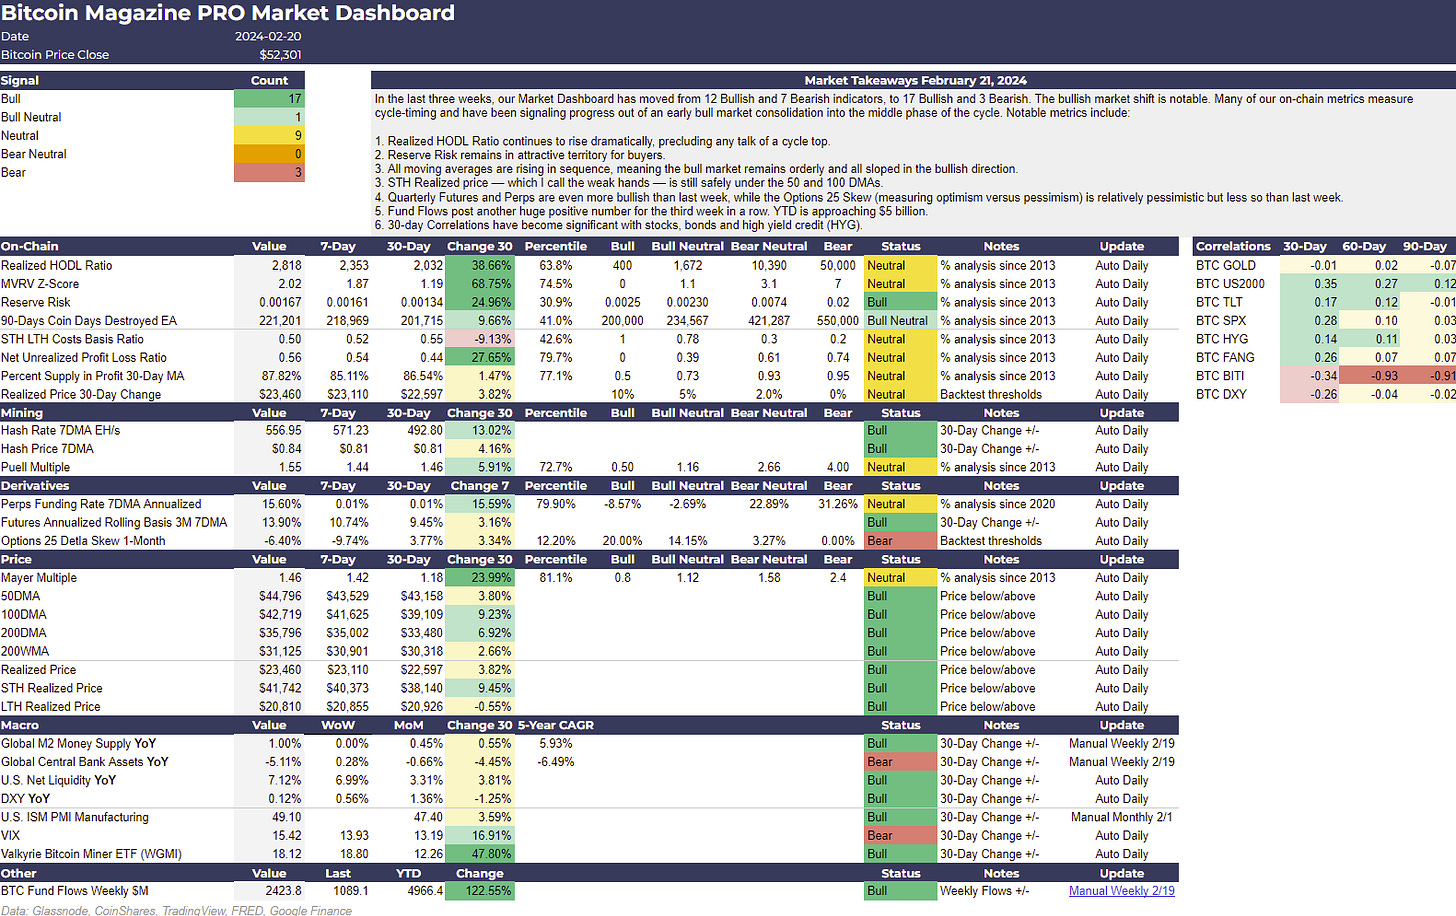
The Realized HODL Ratio stands at a robust 2,817.97, a figure that captures the confidence of long-term investors as it surges with a 30-day change of 38.66%. A high percentile rank of 63.8% supports a bullish sentiment, suggesting that the steadfast HODLers may indeed know best.
The Resilience of Value
Bitcoin's MVRV Z-Score, at 2.02, has experienced a significant 30-day increase of 68.75%, with a percentile rank even higher at 74.5%. This metric is critical as it juxtaposes market value against realized value, hinting at potential market tops and bottoms.
Risk and Reward
Our dashboard's Reserve Risk at 0.00167 reflects the conviction of long-term holders relative to the price of Bitcoin, with a notable 30-day change of 24.96%. It signals that despite the price movements, the confidence of Bitcoin's stalwart supporters remains unshaken.
A Spectrum of Signals
While our bullish indicators are turning heads, the overall signals present a mixed bag with 1 Bull Neutral, 9 Neutral, and 3 Bearish signals. It's a market that teems with caution, a signal to investors to perhaps hedge their bets.
Market Correlations: A Dance with Other Assets
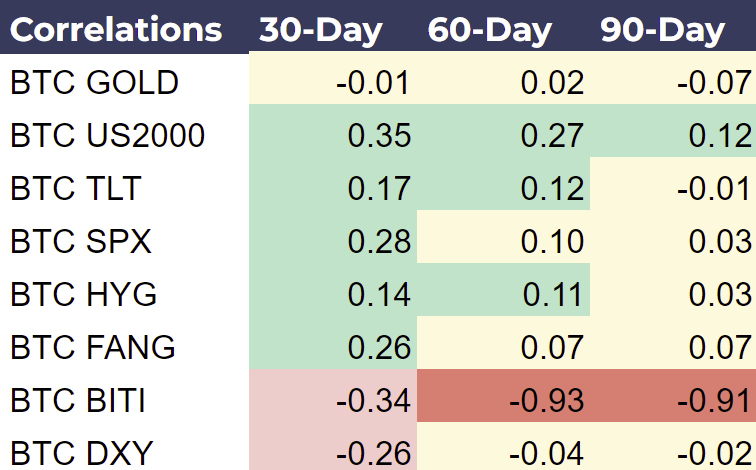
Bitcoin's dance with other financial assets shows a variety of steps. We witness negative correlations with gold over a 90-day period (-0.0716), indicating a potential shift where Bitcoin decouples as a safe haven asset. On the other hand, a positive correlation with the US2000 index (0.3482 over 30 days) shows a parallel in the risk appetite across different asset classes.
Implications for the Market Dynamics
What does this all mean for market dynamics? The confluence of bullish indicators and the orderly rise of moving averages indicate a market that is gaining confidence, yet not without caution. The large-scale fund inflows and the strengthening correlations with traditional assets may suggest a growing integration of Bitcoin into the broader financial narrative.
The data paints a picture of a market that is cautiously optimistic, buoyed by the confidence of long-term investors.
Investor Sentiment: The bullish on-chain metrics could drive a positive investor sentiment, potentially leading to increased buying pressure.
Strategic Trading: The correlations with other financial assets could inform strategic trading, especially for those looking to diversify or hedge within the Bitcoin space and beyond.
Conclusion
The Bitcoin market is a complex ecosystem driven by various on-chain metrics and its interplay with broader financial markets. On-chain metrics and macroeconomic dynamics are all pointing in an optimistic direction, but a hint of caution persists. Whether you are a long-term hodler who wants to keep their emotions in check, or a day-trader looking for an edge, it is important to stay informed on these metrics and be agile.
Stay tuned for our next update, where we will continue to track the important deep fundamentals and price levels. Until then, happy trading.
Full Bitcoin Magazine Pro™ Market Dashboard: 📊
The following is a screenshot of the Bitcoin Magazine Pro™ Market Dashboard. Click the image below ⤵️ to zoom in. 🔍
🔗 Download this week's Bitcoin Magazine Pro Market Dashboard in PDF format. ⤵️
Thank you for reading Bitcoin Magazine Pro™, we sincerely appreciate your support! Please consider leaving a like if you enjoyed this piece. As well, sharing goes a long way toward helping us reach a wider audience!


Don't forget the long-term hodlers who also swing trade a minority percentage of their holdings 😃