


Bitcoin Bull Market Pullback: On-Chain Insights and Macroeconomic Factors
How do corrections and cycle tops differ regarding on-chain metrics? Price levels and the derivatives market is telling us we’re in a typical bull market correction.


Executive Summary
In this post, we take a close look at Bitcoin's market trends, breaking down the on-chain metrics, price trends, and the big-picture economic indicators that all play a role in its value. Bitcoin's on-chain metrics and derivatives market suggest cautious optimism, while the macroeconomic indicators hint at a challenging yet potentially opportunistic environment for Bitcoin. Short-term holder gains and long-term holder consolidation, alongside large spreads between price and support levels, has resulted in the typical bull market volatility.
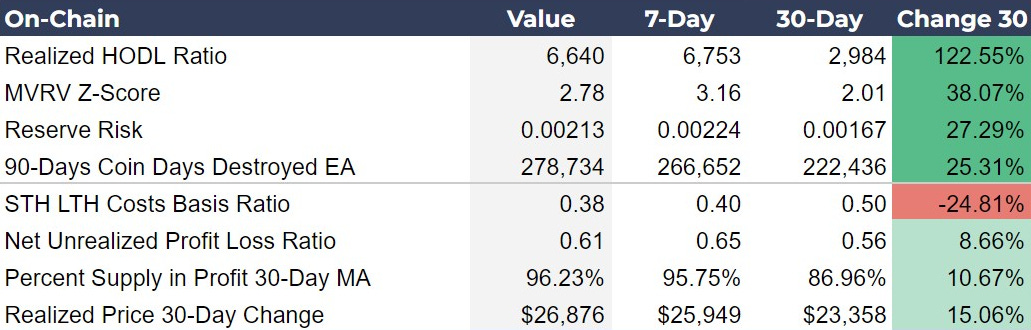
On-chain Metrics
Analyzing the on-chain data, we see clear signs of a market correction. For instance, the Realized HODL Ratio increased significantly over 30 days, indicating that long-term holders are less inclined to sell, which could be a bullish signal. At the same time, over the last 7 days the HODL Ratio is down slightly. The MVRV Z-Score, which helps identify speculative excesses, saw a rise over 7 days but less so than the enormous increase over 30 days, again suggesting a period of consolidation. The Reserve Risk increased, suggesting higher confidence among long-term investors despite increased prices over 30 days, but it too fell over a 7-day span.
The Coin Days Destroyed metric, which indicates the movement of old coins, saw an increase over the month, potentially signaling increased activity or shifts among long-term holders. Conversely, the STH LTH Costs Basis Ratio decreased over 30 days, suggesting a shift in the cost basis between short-term and long-term holders. The Net Unrealized Profit/Loss Ratio and the Percent Supply in Profit both increased, pointing towards a generally optimistic market sentiment.
Investor Insights
Hodl through corrections: The increase in the Realized HODL Ratio and Reserve Risk suggests a strong holding sentiment among long-term investors, indicating potential upward pressure on bitcoin prices if the trend persists.
Long-term trends trump short-term corrections: The significant 30-day increase in MVRV Z-Score and the Net Unrealized Profit/Loss Ratio suggests growing optimism and valuation in the market, which investors might interpret as a signal for a bullish trend, but they should also be wary of potential speculative excesses.
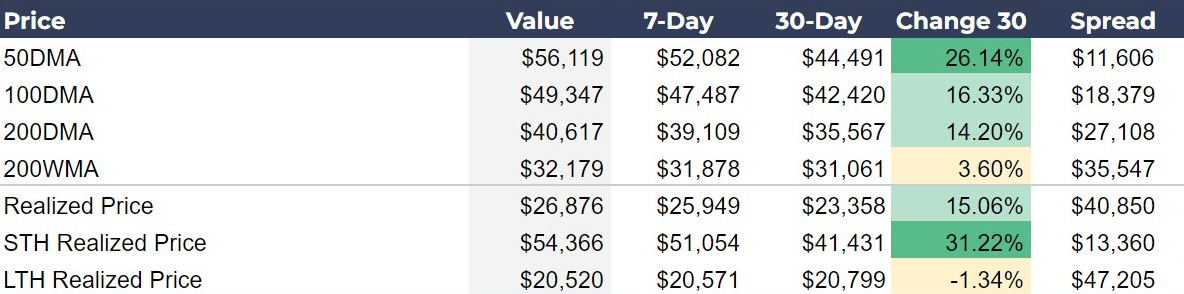
Price Metrics: Moving Averages and Holder Realized Prices Amidst Recent Volatility
The price section shows a significant bullish trend, highlighted by current price exceeding key moving averages, despite today’s 5% drop. Our analysis uncovers a notable disparity between short-term and long-term holder realized prices, suggesting a dynamic interplay in the market.
Price metrics have been our most bullish part of the dashboard for months now. With the significant rise in price, we are safely above all moving averages which should act as support in any unlikely extreme sell-off event. The 50-day moving average (DMA), 100DMA, and 200DMA are all significantly below the current price, even considering today's decline, indicating a bullish trend over these periods. Do not let a short-term correction, that we’ve been expecting and forecasting, make you question the bullish trend.
Particularly notable is the Short-Term Holder (STH) Realized Price, which has surged 31.22%, indicating that recent buyers are significantly in profit. In contrast, the Long-Term Holder (LTH) Realized Price has slightly decreased, suggesting a consolidation or distribution phase among long-term investors. ETF buyers will be tested, with a ton of volume now holding at a loss (see chart of the day below).
Investor Insights
Volatility in bull markets: The significant spread between the current price and key moving averages reflects strong bullish momentum. However, investors should be aware this can also lead to higher volatility, as support provided by bids at these levels are further away. Rapid price gains always have a potential for significant corrections.
Phase dynamics: The disparity between STH and LTH Realized Prices suggests a dynamic market, where short-term holders are potentially driving the price up. Long-term holders showing a slight decrease in their realized price could indicate a mature market phase, where profit-taking or redistribution might occur, potentially impacting short-term price movements.
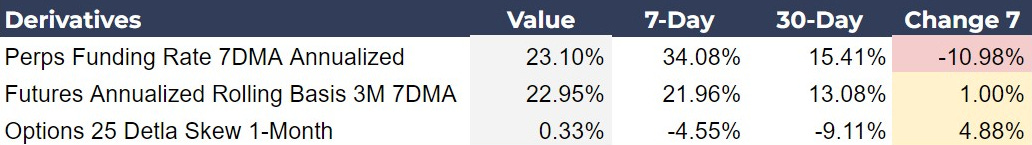
Derivatives: Cooling Perps and Rising Sentiment in Futures and Options
Bitcoin's derivatives market is showing the much anticipated signs of cooling off in perpetual futures, paired with a modest rise in futures premiums. We also see a shift in options market sentiment, reflecting changing trader expectations and risk assessments.
The perps funding rate, annualized over 7 days, is at 23.10%, down from 34.08% a week ago, indicating a decrease in the cost to hold long positions in perpetual futures. This -10.98% change suggests a cooling off from previously higher leverage or bullish sentiment in the perp market. In contrast, the futures annualized rolling basis for 3 months has slightly increased to 22.95% from 21.96% over the week, showing a marginal growth in futures premium, which could indicate a mild increase in bullish sentiment or hedging activity.
The options 25 delta skew, which measures the relative cost of puts vs. calls, has shifted from a negative value to a positive 0.33%, indicating a change from bearish to slightly bullish or neutral sentiment among options traders over the past week. This shift could suggest a decrease in demand for protective puts or an increase in calls buying.
Investor Insights
Appearances can be deceiving: The decrease in the perpetual futures funding rate suggests that traders are reducing leverage or becoming less aggressive in their long positions, which could be a sign of caution or a potential shift in market sentiment. However, nothing in our derivatives numbers points directly to a bearish shift, quite the opposite. This is what is expected from a consolidation.
Temporary correction: The shift from negative to positive in the options 25 delta skew is very notable, because it has been negative for over a month. It was a key indicator that consolidation was coming. The positive shift reflects a sentiment change about perceived downside risk and an increased optimism for upward price movement in the short term. In other words, this pullback is temporary.
Macro: A Complex Environment
Our macroeconomic indicators reveal a macro landscape with a slight increase in global money supply contrasted by a tightening in central bank assets and US liquidity. The data also highlights a depreciating dollar and a contraction in manufacturing activity, setting a complex stage for Bitcoin's interaction with broader economic trends.
The year-over-year (YoY) change in the Global M2 Money Supply shows a slight increase, indicating a modest expansion in global liquidity, which should have a positive effect on risk assets like Bitcoin. However, Global Central Bank Assets have contracted significantly, suggesting a tightening monetary environment. US Net Liquidity has increased month-over-month but shows a significant slowdown in the rate of growth since last week. Rapid changes to liquidity can create risk in the banking system.
The dollar index (DXY) is down very slightly YoY, but the biggest takeaway is that it has been quite steady, despite other’s predictions to the contrary. The US ISM PMI, an indicator of manufacturing health, indicates worsening contraction, adding evidence to an official recession later this year, which should benefit Bitcoin as a safe haven asset. Lastly, the VIX remains relatively low, suggesting no broad market panic, yet. This gives bitcoin the opportunity to rise with risk assets in the meantime, prior to recession.
Investor Insights
Complex backdrop: The slight increase in global money supply amidst a tightening monetary environment creates a complex backdrop for Bitcoin, potentially enhancing its appeal as a hedge against currency devaluation and system credit risk at the same time.
Evidence of recession: The decline in the DXY and the contraction in manufacturing activity provides evidence to confirm an economic slowdown is approaching. In the past, that would negatively affect bitcoin, however, with the absurdly successful launch of the spot ETFs, Bitcoin is not likely to see any significant sustained downside. It is maturing into a new phase as a safe haven.
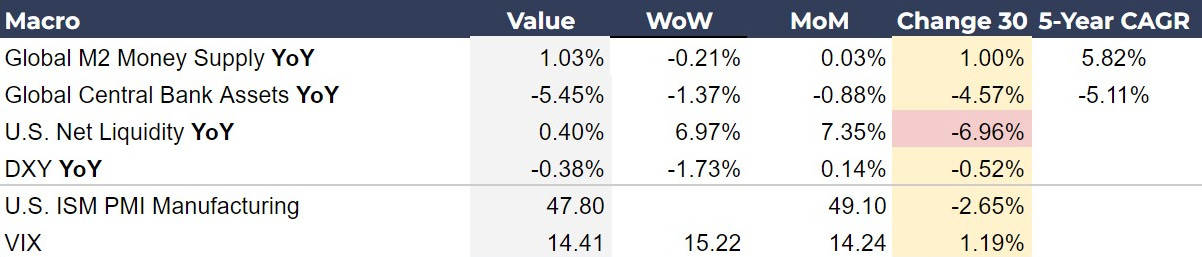
Chart of the Day
Hodling is not easy. Typically, outsiders have this opinion that we got lucky, or all you have to do is buy and wait. The latter is true, but it’s far from easy. Imagine being a traditional boomer and you were finally convinced to buy some bitcoin via the new ETFs after refusing for years. You open up your app a week later and you are down 10%. New investors are being tested right now. This is a typical wash-out of weak hands in a bull market. There’s no free lunch.
We went very high very fast, hit overbought levels, and it is only natural to pullback within a broader bull market. If we are in a “super cycle”, one that will skyrocket price to global adoption territory, the rises will be dizzying and the pullbacks will be vicious. Hold tight. Our metrics above are consistent with a temporary pullback, not a cyclical top. There are signs we are bottoming or close to it.

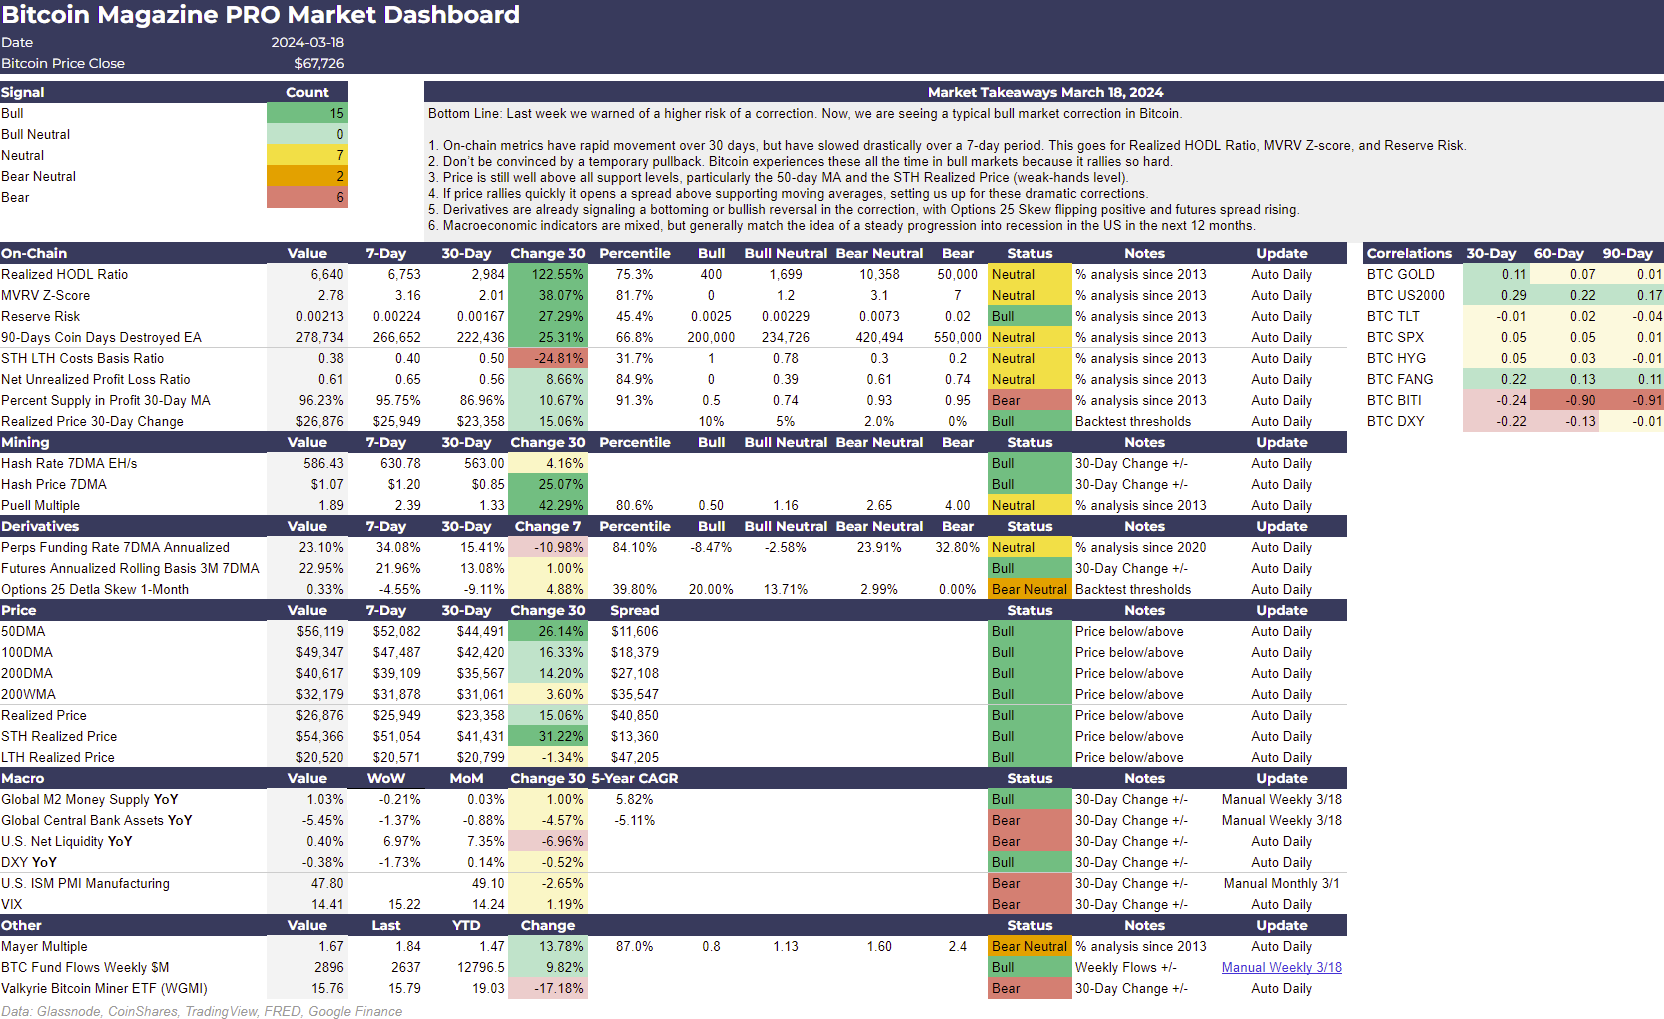
Bitcoin Magazine Pro™ Market Dashboard
The following is a screenshot of the Bitcoin Magazine Pro™ Market Dashboard. Click the image below ⤵️ to zoom in. 🔍
🔗 Download this week's Bitcoin Magazine Pro Market Dashboard in PDF format. ⤵️
If you liked this content please give a like and share! Comment below with your reactions to this post and any recommendations for future topics.
Thank you for reading Bitcoin Magazine Pro™, we sincerely appreciate your support!
Not Financial Advice.
 | A guest post by
|
Love the insights, great job 👍