


Signs of Renewed Trader Activity and Price Growth in Bitcoin
Signs of Renewed Trader Activity and Price Growth in Bitcoin
Analyzing Stabilizing On-Chain Metrics, Resurging Derivative Markets, and Key Macroeconomic Shifts Set to Influence Bitcoin's Price


Introduction
Today, we're diving into the latest Bitcoin market trends and their implications for investors. We'll examine the current state of Bitcoin's on-chain metrics, which are showing signs of stabilization and potential reversal out of consolidation. We'll also explore price metrics and derivative markets, noting a potential resurgence of trader activity after a post-halving lull. Lastly, we'll discuss crucial macroeconomic indicators that impact Bitcoin. Surprisingly, these indicators are signaling recessionary trends in monetary aggregates, alongside the first positive Bitcoin Fund Flow in five weeks. Let's dive in.
On-chain metrics
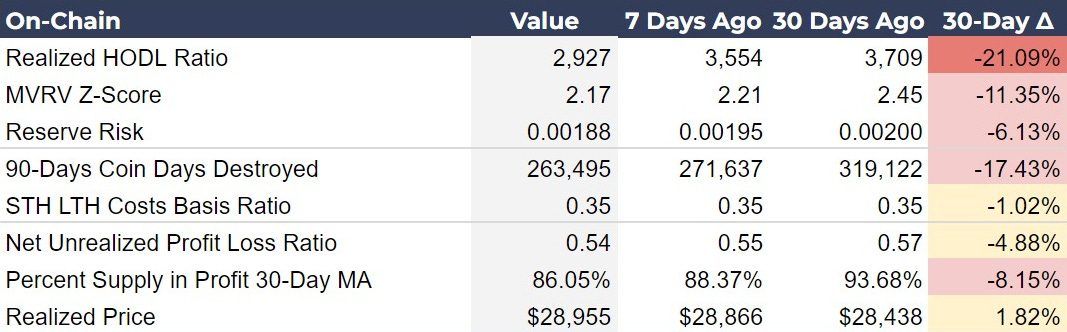
Bitcoin appears to be finding a little foothold, according to on-chain metrics. They are still falling in a consolidation phase, but the rate of decline is slowing noticeably. They suggest a marked decline in speculative behavior and a strengthening of long-term holding strategies.
The Realized HODL Ratio continues a significant pull back week-over-week (WoW), meaning that the ratio between realized price for 1-week old UTXOs vs 1-2 year old UTXOs is dropping. In other words, a decline in this metric means that the spread or advantage for longer term hodlers is declining. However, it is still inline with expectations for a mid-cycle consolidation, not a bear market.
Coin Days Destroyed is affected most by old UTXOs moving, and it has consistently gone down WoW. This is indicative of a slowing distribution of supply from older to newer holders. With ongoing sources of demand, and new sources popping up every day, this slowing distribution can materialize quickly into a supply shortage.
The MVRV Z-Score, last week increased WoW, and is still relatively stable this week. MVRV is the ratio between market price and realized price used to identify cycle tops and bottoms. We can also use it to help us identify the bottom of a consolidation within a bull market, which appears to be what is happening right now.
Reserve Risk continues to decline, meaning market confidence at this steady price is rising, and it is becoming a more attractive risk/reward for new investors.
The LTH:STH Cost Basis Ratio has again remained very steady this week, indicating that gains or losses to STH and LTH are roughly equal, because price being flat has allowed both cost bases to also flatten out. However, since the LTH cost basis doesn’t move very much in explosive bull markets, it is the STH cost basis that rises rapidly, this metric should fall as the bull market resumes.
Investor Insights
Accumulation Strategy: The current data suggest that Bitcoin is in a phase where strategic accumulation is advantageous. With indicators pointing towards a stabilizing and improving risk/reward, this is a great time for investors to add to, or open, a position, especially if they are planning for long-term holdings.
What to Watch for Specifically: Realized HODL Ratio has been the lagging indicator over the last couple of weeks. A noted bullish week, accompanied by the RHODL Ratio rising significantly, will tick the one major on-chain box left to check off before the next leg.
Keep reading with a 7-day free trial
Subscribe to Bitcoin Magazine Pro™ to keep reading this post and get 7 days of free access to the full post archives.
 | A guest post by
|