


Is Bitcoin's Market Correction Peaking?
Is Bitcoin's Market Correction Peaking?
A look at on-chain data, price trends, derivatives insights, and global economic indicators as we approach the critical halving event.


Introduction
As we've observed since the launch of the recent spot ETF, the Bitcoin market experienced an intense heat-up, necessitating a period of correction and consolidation to stabilize from speculative excess. Today, we discuss the nuances of this adjustment phase, signaling what appears to be a climax in the market's correction. This analysis not only elucidates the current state of affairs following the ETF-induced fervor but also forecasts the potential paths ahead as we edge closer to critical events like Bitcoin's halving.
On-Chain Data Summary
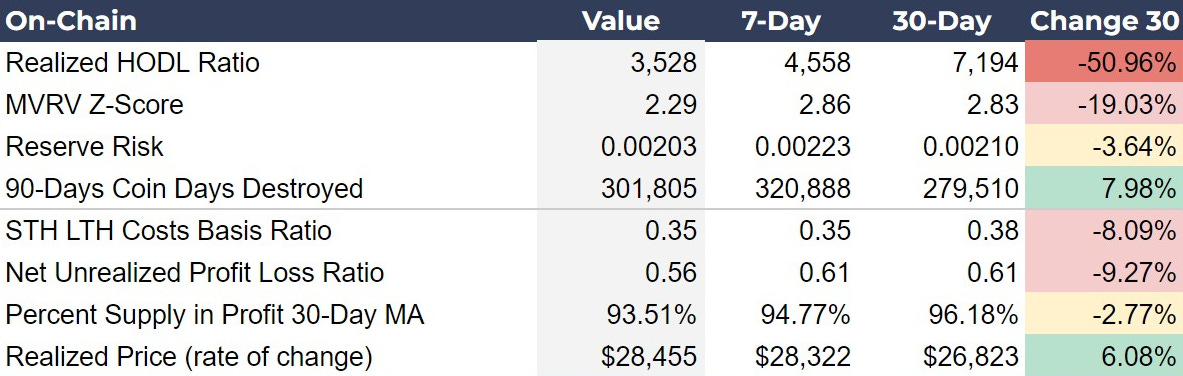
The on-chain data for Bitcoin indicates increased market activity and movement of older coins, alongside a slight decrease in long-term holder confidence and profit margins, suggesting a period of market adjustment and potential volatility.
Realized HODL Ratio’s sharp decrease suggests a lower conviction in holding Bitcoin, indicating that older coins are moving, which can imply selling pressure or redistribution.
MVRV Z-Score, which measures market value against realized value, declined slightly implying that Bitcoin is cooling off after a possibly overheated market. This matches our previous forecasts.
Reserve Risk decreased marginally to 0.00200 from 0.00214. This suggests that the conviction of long-term holders has weakened slightly.
90-Days Coin Days Destroyed increased to 319,196 from 280,815 over 30 days, but has decreased slightly week-over-week, indicating that older coins, previously dormant, are still moving, but the early flush has subsided somewhat. This is consistent with distribution in a bull market correction.
STH LTH Costs Basis Ratio shows a slight decrease from 0.38 to 0.35 suggesting that the cost basis of short-term holders relative to long-term holders is decreasing. This indicates net short-term selling relative to buying, and signals a bottoming process in any correction.
Investor Insights
Realized HODL Ratio & 90-Days Coin Days Destroyed (CDD): The significant movement of older coins combined with a sharp drop in the Realized HODL Ratio on the month suggests heightened selling pressure distribution. However, the slowing in the Realized HODL and the shift in the CDD over the last 7 days tell us this pressure is waning.
MVRV Z-Score & Reserve Risk: The behavior of these two indicators are typical results of a correction. They do not outright point to lower prices in the near term, but a medium term return to the bullish trend.
Halving Countdown: The final moves of this correction phase could be exacerbated by uncertainty surrounding the halving and geopolitical stress. Expect a bottom to be founded as this uncertainty is cured by the halving itself.
Bitcoin Price Trends and Reversals
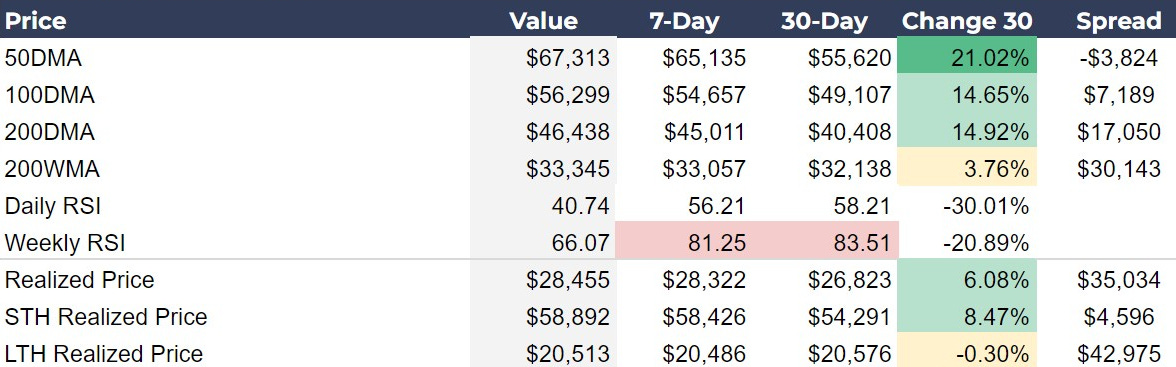
The data shows a robust upward trend in Bitcoin's short to medium-term moving averages, with significant increases in the 50-day and 100-day. However, the recent drop of the spot price below the 50DMA suggests a potential short-term reversal and warrants a cautious approach to recognizing the bottom of the correction.
Keep reading with a 7-day free trial
Subscribe to Bitcoin Magazine Pro™ to keep reading this post and get 7 days of free access to the full post archives.
 | A guest post by
|